New Zealander vs Immigrants from Jamaica Male Unemployment

COMPARE

New Zealander
Race
Ancestry
AfghanAfricanAlaska NativeAlaskan AthabascanAlbanianAleutAlsatianAmericanApacheArabArapahoArgentineanArmenianAssyrian/Chaldean/SyriacAustralianAustrianBahamianBangladeshiBarbadianBasqueBelgianBelizeanBermudanBhutaneseBlackfeetBolivianBrazilianBritishBritish West IndianBulgarianBurmeseCajunCambodianCanadianCape VerdeanCarpatho RusynCelticCentral AmericanCentral American IndianCherokeeCheyenneChickasawChileanChineseChippewaChoctawColombianColvilleComancheCosta RicanCreeCreekCroatianCrowCubanCypriotCzechCzechoslovakianDanishDelawareDominicanDutchDutch West IndianEastern EuropeanEcuadorianEgyptianEnglishEstonianEthiopianEuropeanFijianFilipinoFinnishFrenchFrench American IndianFrench CanadianGermanGerman RussianGhanaianGreekGuamanian/ChamorroGuatemalanGuyaneseHaitianHmongHonduranHopiHoumaHungarianIcelanderIndian (Asian)IndonesianInupiatIranianIraqiIrishIroquoisIsraeliItalianJamaicanJapaneseJordanianKenyanKiowaKoreanLaotianLatvianLebaneseLiberianLithuanianLumbeeLuxembourgerMacedonianMalaysianMalteseMarshalleseMenomineeMexicanMexican American IndianMongolianMoroccanNative HawaiianNavajoNepaleseNew ZealanderNicaraguanNigerianNorthern EuropeanNorwegianOkinawanOsageOttawaPaiutePakistaniPalestinianPanamanianParaguayanPennsylvania GermanPeruvianPimaPolishPortuguesePotawatomiPuebloPuerto RicanPuget Sound SalishRomanianRussianSalvadoranSamoanScandinavianScotch-IrishScottishSeminoleSenegaleseSerbianShoshoneSierra LeoneanSiouxSlavicSlovakSloveneSomaliSouth AfricanSouth AmericanSouth American IndianSoviet UnionSpaniardSpanishSpanish AmericanSpanish American IndianSri LankanSubsaharan AfricanSudaneseSwedishSwissSyrianTaiwaneseThaiTlingit-HaidaTohono O'OdhamTonganTrinidadian and TobagonianTsimshianTurkishU.S. Virgin IslanderUgandanUkrainianUruguayanUteVenezuelanVietnameseWelshWest IndianYakamaYaquiYugoslavianYumanYup'ikZimbabwean
Immigration
NonimmigrantsImmigrantsAfghanistanAfricaAlbaniaArgentinaArmeniaAsiaAustraliaAustriaBahamasBangladeshBarbadosBelarusBelgiumBelizeBoliviaBosnia and HerzegovinaBrazilBulgariaBurma/MyanmarCabo VerdeCambodiaCameroonCanadaCaribbeanCentral AmericaChileChinaColombiaCongoCosta RicaCroatiaCubaCzechoslovakiaDenmarkDominicaDominican RepublicEastern AfricaEastern AsiaEastern EuropeEcuadorEgyptEl SalvadorEnglandEritreaEthiopiaEuropeFijiFranceGermanyGhanaGreeceGrenadaGuatemalaGuyanaHaitiHondurasHong KongHungaryIndiaIndonesiaIranIraqIrelandIsraelItalyJapanJordanKazakhstanKenyaKoreaKuwaitLaosLatin AmericaLatviaLebanonLiberiaLithuaniaMalaysiaMexicoMicronesiaMiddle AfricaMoldovaMoroccoNepalNetherlandsNicaraguaNigeriaNorth AmericaNorth MacedoniaNorthern AfricaNorthern EuropeNorwayOceaniaPakistanPanamaPeruPhilippinesPolandPortugalRomaniaRussiaSaudi ArabiaScotlandSenegalSerbiaSierra LeoneSingaporeSomaliaSouth AfricaSouth AmericaSouth Central AsiaSouth Eastern AsiaSouthern EuropeSpainSri LankaSt. Vincent and the GrenadinesSudanSwedenSwitzerlandSyriaTaiwanThailandTrinidad and TobagoTurkeyUgandaUkraineUruguayUzbekistanVenezuelaVietnamWest IndiesWestern AfricaWestern AsiaWestern EuropeYemenZaireZimbabweAzores
Immigrants from Jamaica
Race
Ancestry
AfghanAfricanAlaska NativeAlaskan AthabascanAlbanianAleutAlsatianAmericanApacheArabArapahoArgentineanArmenianAssyrian/Chaldean/SyriacAustralianAustrianBahamianBangladeshiBarbadianBasqueBelgianBelizeanBermudanBhutaneseBlackfeetBolivianBrazilianBritishBritish West IndianBulgarianBurmeseCajunCambodianCanadianCape VerdeanCarpatho RusynCelticCentral AmericanCentral American IndianCherokeeCheyenneChickasawChileanChineseChippewaChoctawColombianColvilleComancheCosta RicanCreeCreekCroatianCrowCubanCypriotCzechCzechoslovakianDanishDelawareDominicanDutchDutch West IndianEastern EuropeanEcuadorianEgyptianEnglishEstonianEthiopianEuropeanFijianFilipinoFinnishFrenchFrench American IndianFrench CanadianGermanGerman RussianGhanaianGreekGuamanian/ChamorroGuatemalanGuyaneseHaitianHmongHonduranHopiHoumaHungarianIcelanderIndian (Asian)IndonesianInupiatIranianIraqiIrishIroquoisIsraeliItalianJamaicanJapaneseJordanianKenyanKiowaKoreanLaotianLatvianLebaneseLiberianLithuanianLumbeeLuxembourgerMacedonianMalaysianMalteseMarshalleseMenomineeMexicanMexican American IndianMongolianMoroccanNative HawaiianNavajoNepaleseNicaraguanNigerianNorthern EuropeanNorwegianOkinawanOsageOttawaPaiutePakistaniPalestinianPanamanianParaguayanPennsylvania GermanPeruvianPimaPolishPortuguesePotawatomiPuebloPuerto RicanPuget Sound SalishRomanianRussianSalvadoranSamoanScandinavianScotch-IrishScottishSeminoleSenegaleseSerbianShoshoneSierra LeoneanSiouxSlavicSlovakSloveneSomaliSouth AfricanSouth AmericanSouth American IndianSoviet UnionSpaniardSpanishSpanish AmericanSpanish American IndianSri LankanSubsaharan AfricanSudaneseSwedishSwissSyrianTaiwaneseThaiTlingit-HaidaTohono O'OdhamTonganTrinidadian and TobagonianTsimshianTurkishU.S. Virgin IslanderUgandanUkrainianUruguayanUteVenezuelanVietnameseWelshWest IndianYakamaYaquiYugoslavianYumanYup'ikZimbabwean
Immigration
NonimmigrantsImmigrantsAfghanistanAfricaAlbaniaArgentinaArmeniaAsiaAustraliaAustriaBahamasBangladeshBarbadosBelarusBelgiumBelizeBoliviaBosnia and HerzegovinaBrazilBulgariaBurma/MyanmarCabo VerdeCambodiaCameroonCanadaCaribbeanCentral AmericaChileChinaColombiaCongoCosta RicaCroatiaCubaCzechoslovakiaDenmarkDominicaDominican RepublicEastern AfricaEastern AsiaEastern EuropeEcuadorEgyptEl SalvadorEnglandEritreaEthiopiaEuropeFijiFranceGermanyGhanaGreeceGrenadaGuatemalaGuyanaHaitiHondurasHong KongHungaryIndiaIndonesiaIranIraqIrelandIsraelItalyJamaicaJapanJordanKazakhstanKenyaKoreaKuwaitLaosLatin AmericaLatviaLebanonLiberiaLithuaniaMalaysiaMexicoMicronesiaMiddle AfricaMoldovaMoroccoNepalNetherlandsNicaraguaNigeriaNorth AmericaNorth MacedoniaNorthern AfricaNorthern EuropeNorwayOceaniaPakistanPanamaPeruPhilippinesPolandPortugalRomaniaRussiaSaudi ArabiaScotlandSenegalSerbiaSierra LeoneSingaporeSomaliaSouth AfricaSouth AmericaSouth Central AsiaSouth Eastern AsiaSouthern EuropeSpainSri LankaSt. Vincent and the GrenadinesSudanSwedenSwitzerlandSyriaTaiwanThailandTrinidad and TobagoTurkeyUgandaUkraineUruguayUzbekistanVenezuelaVietnamWest IndiesWestern AfricaWestern AsiaWestern EuropeYemenZaireZimbabweAzores
Male Unemployment
Income
Poverty
Unemployment
Labor Participation
Family Structure
Vehicle Availability
Education Level
Disability

Male Unemployment Comparison

New Zealanders

Immigrants from Jamaica

Exceptional
Tragic
5.0%
MALE UNEMPLOYMENT
97.3/ 100
METRIC RATING
71st/ 347
METRIC RANK
6.7%
MALE UNEMPLOYMENT
0.0/ 100
METRIC RATING
307th/ 347
METRIC RANK

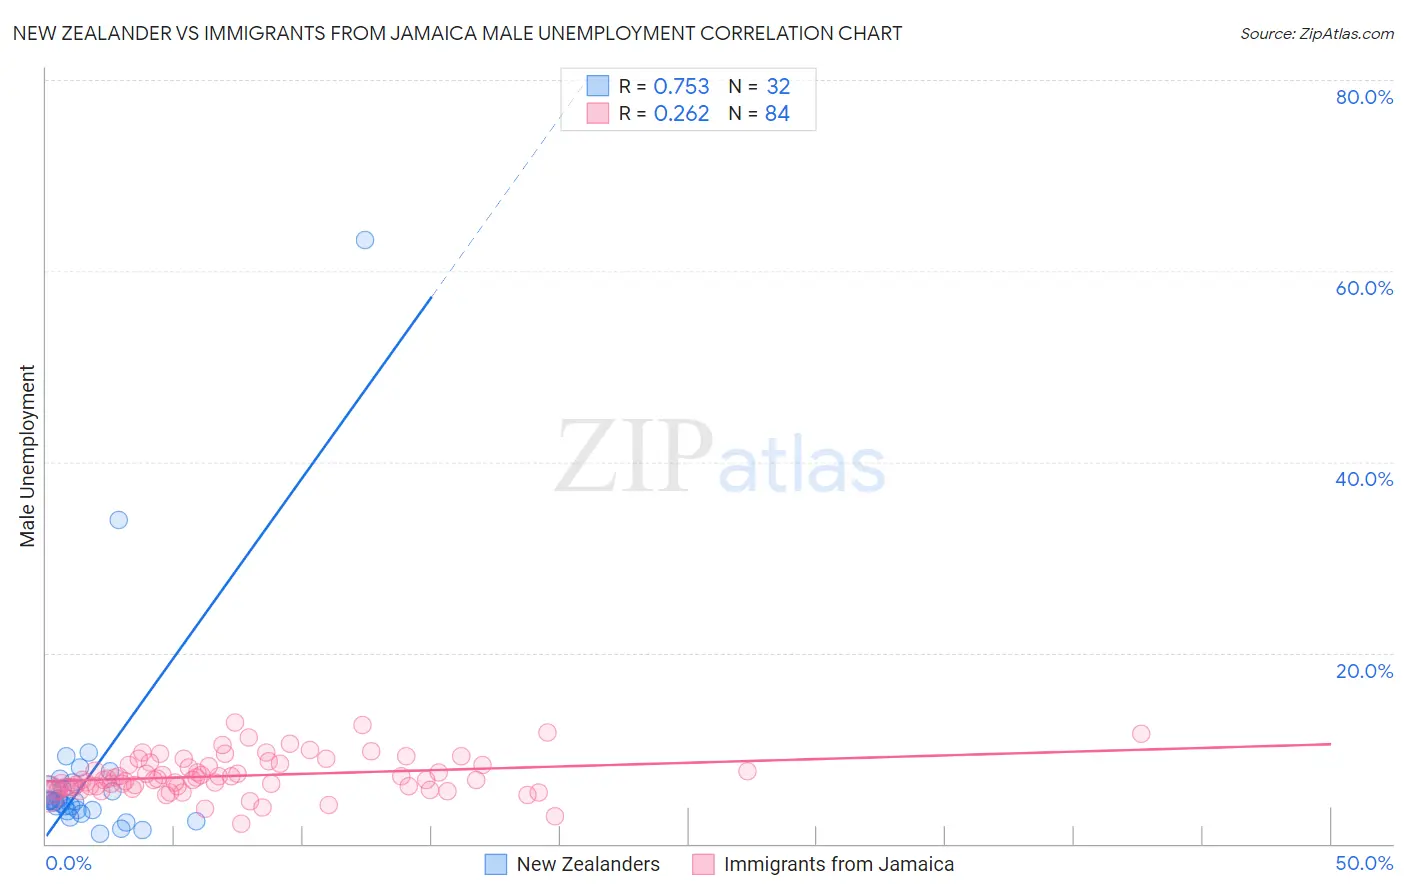
New Zealander vs Immigrants from Jamaica Male Unemployment Correlation Chart

The statistical analysis conducted on geographies consisting of 106,769,284 people shows a strong positive correlation between the proportion of New Zealanders and unemployment rate among males in the United States with a correlation coefficient (R) of 0.753 and weighted average of 5.0%. Similarly, the statistical analysis conducted on geographies consisting of 300,907,129 people shows a weak positive correlation between the proportion of Immigrants from Jamaica and unemployment rate among males in the United States with a correlation coefficient (R) of 0.262 and weighted average of 6.7%, a difference of 33.5%.
New Zealander vs Immigrants from Jamaica Male Unemployment

Male Unemployment Correlation Summary

MeasurementNew ZealanderImmigrants from Jamaica
Minimum1.1%2.1%
Maximum63.2%12.7%
Range62.1%10.6%
Mean7.3%7.1%
Median4.4%6.7%
Interquartile 25% (IQ1)3.5%5.9%
Interquartile 75% (IQ3)6.1%8.3%
Interquartile Range (IQR)2.6%2.4%
Standard Deviation (Sample)11.6%2.0%
Standard Deviation (Population)11.4%2.0%

Similar Demographics by Male Unemployment

Demographics Similar to New Zealanders by Male Unemployment

In terms of male unemployment, the demographic groups most similar to New Zealanders are White/Caucasian (5.0%, a difference of 0.020%), Immigrants from Sweden (5.0%, a difference of 0.070%), Immigrants from South Africa (5.0%, a difference of 0.070%), Australian (5.0%, a difference of 0.10%), and Immigrants from Canada (5.0%, a difference of 0.11%).
DemographicsRating | RankMale Unemployment
Celtics
97.8
/100
|
#64
Exceptional
5.0%
Icelanders
97.6
/100
|
#65
Exceptional
5.0%
Finns
97.5
/100
|
#66
Exceptional
5.0%
Immigrants | Canada
97.5
/100
|
#67
Exceptional
5.0%
Australians
97.4
/100
|
#68
Exceptional
5.0%
Immigrants | Sweden
97.4
/100
|
#69
Exceptional
5.0%
Whites/Caucasians
97.3
/100
|
#70
Exceptional
5.0%
New Zealanders
97.3
/100
|
#71
Exceptional
5.0%
Immigrants | South Africa
97.1
/100
|
#72
Exceptional
5.0%
Greeks
97.0
/100
|
#73
Exceptional
5.0%
Immigrants | North America
96.9
/100
|
#74
Exceptional
5.0%
Assyrians/Chaldeans/Syriacs
96.9
/100
|
#75
Exceptional
5.0%
Immigrants | Sudan
96.5
/100
|
#76
Exceptional
5.0%
Iranians
96.4
/100
|
#77
Exceptional
5.0%
Immigrants | Northern Europe
96.4
/100
|
#78
Exceptional
5.0%

Demographics Similar to Immigrants from Jamaica by Male Unemployment

In terms of male unemployment, the demographic groups most similar to Immigrants from Jamaica are Immigrants from Trinidad and Tobago (6.7%, a difference of 0.080%), Trinidadian and Tobagonian (6.7%, a difference of 0.28%), Immigrants from West Indies (6.7%, a difference of 0.60%), West Indian (6.7%, a difference of 0.60%), and Ute (6.6%, a difference of 0.97%).
DemographicsRating | RankMale Unemployment
Vietnamese
0.0
/100
|
#300
Tragic
6.6%
Immigrants | Belize
0.0
/100
|
#301
Tragic
6.6%
Ute
0.0
/100
|
#302
Tragic
6.6%
Immigrants | West Indies
0.0
/100
|
#303
Tragic
6.7%
West Indians
0.0
/100
|
#304
Tragic
6.7%
Trinidadians and Tobagonians
0.0
/100
|
#305
Tragic
6.7%
Immigrants | Trinidad and Tobago
0.0
/100
|
#306
Tragic
6.7%
Immigrants | Jamaica
0.0
/100
|
#307
Tragic
6.7%
Aleuts
0.0
/100
|
#308
Tragic
6.8%
Barbadians
0.0
/100
|
#309
Tragic
6.9%
Blacks/African Americans
0.0
/100
|
#310
Tragic
6.9%
Immigrants | Armenia
0.0
/100
|
#311
Tragic
6.9%
Lumbee
0.0
/100
|
#312
Tragic
6.9%
Immigrants | Dominica
0.0
/100
|
#313
Tragic
7.0%
Immigrants | Barbados
0.0
/100
|
#314
Tragic
7.1%