Nepalese vs Immigrants from Caribbean Female Unemployment
COMPARE
Nepalese
Immigrants from Caribbean
Female Unemployment
Female Unemployment Comparison
Nepalese
Immigrants from Caribbean
5.9%
FEMALE UNEMPLOYMENT
0.0/ 100
METRIC RATING
267th/ 347
METRIC RANK
6.1%
FEMALE UNEMPLOYMENT
0.0/ 100
METRIC RATING
290th/ 347
METRIC RANK
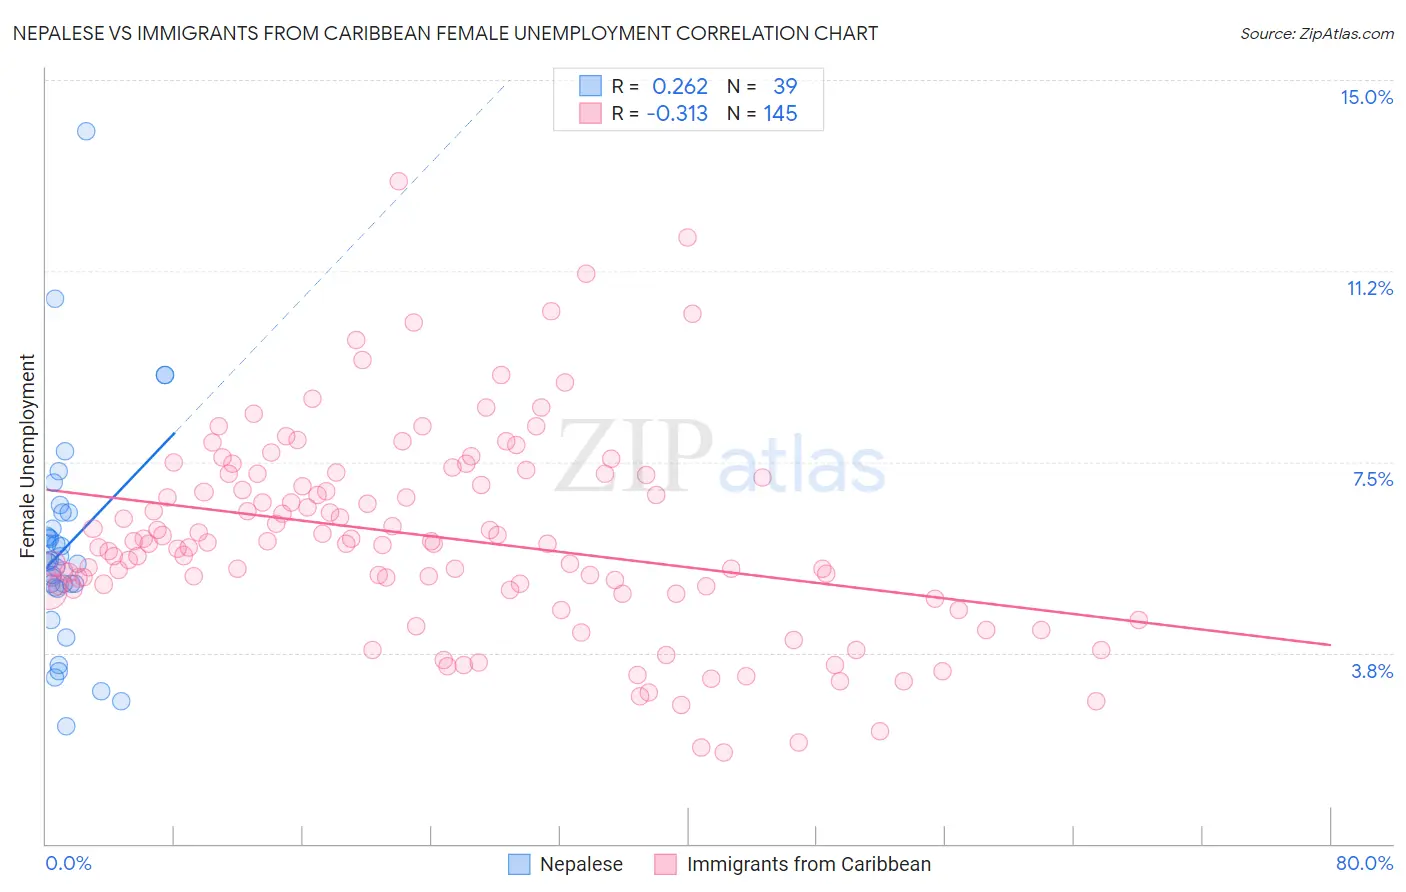
Nepalese vs Immigrants from Caribbean Female Unemployment Correlation Chart
The statistical analysis conducted on geographies consisting of 24,519,269 people shows a weak positive correlation between the proportion of Nepalese and unemploymnet rate among females in the United States with a correlation coefficient (R) of 0.262 and weighted average of 5.9%. Similarly, the statistical analysis conducted on geographies consisting of 447,357,611 people shows a mild negative correlation between the proportion of Immigrants from Caribbean and unemploymnet rate among females in the United States with a correlation coefficient (R) of -0.313 and weighted average of 6.1%, a difference of 3.5%.
Female Unemployment Correlation Summary
| Measurement | Nepalese | Immigrants from Caribbean |
| Minimum | 2.3% | 1.8% |
| Maximum | 14.0% | 13.0% |
| Range | 11.7% | 11.2% |
| Mean | 5.8% | 6.0% |
| Median | 5.5% | 5.9% |
| Interquartile 25% (IQ1) | 5.0% | 5.0% |
| Interquartile 75% (IQ3) | 6.5% | 7.3% |
| Interquartile Range (IQR) | 1.5% | 2.3% |
| Standard Deviation (Sample) | 2.2% | 2.0% |
| Standard Deviation (Population) | 2.1% | 2.0% |
Similar Demographics by Female Unemployment
Demographics Similar to Nepalese by Female Unemployment
In terms of female unemployment, the demographic groups most similar to Nepalese are Honduran (5.9%, a difference of 0.10%), Cape Verdean (5.9%, a difference of 0.11%), Immigrants from Western Africa (5.9%, a difference of 0.30%), Blackfeet (5.9%, a difference of 0.39%), and Immigrants from Honduras (5.9%, a difference of 0.71%).
| Demographics | Rating | Rank | Female Unemployment |
| Nigerians | 0.2 /100 | #260 | Tragic 5.8% |
| Kiowa | 0.1 /100 | #261 | Tragic 5.8% |
| Immigrants | Nigeria | 0.1 /100 | #262 | Tragic 5.8% |
| Immigrants | Azores | 0.1 /100 | #263 | Tragic 5.8% |
| Immigrants | Bahamas | 0.1 /100 | #264 | Tragic 5.8% |
| Blackfeet | 0.0 /100 | #265 | Tragic 5.9% |
| Cape Verdeans | 0.0 /100 | #266 | Tragic 5.9% |
| Nepalese | 0.0 /100 | #267 | Tragic 5.9% |
| Hondurans | 0.0 /100 | #268 | Tragic 5.9% |
| Immigrants | Western Africa | 0.0 /100 | #269 | Tragic 5.9% |
| Immigrants | Honduras | 0.0 /100 | #270 | Tragic 5.9% |
| Central Americans | 0.0 /100 | #271 | Tragic 5.9% |
| Lumbee | 0.0 /100 | #272 | Tragic 5.9% |
| Ghanaians | 0.0 /100 | #273 | Tragic 5.9% |
| Africans | 0.0 /100 | #274 | Tragic 5.9% |
Demographics Similar to Immigrants from Caribbean by Female Unemployment
In terms of female unemployment, the demographic groups most similar to Immigrants from Caribbean are Trinidadian and Tobagonian (6.1%, a difference of 0.060%), Haitian (6.1%, a difference of 0.070%), Immigrants from Guatemala (6.1%, a difference of 0.11%), Immigrants from West Indies (6.1%, a difference of 0.11%), and Chippewa (6.1%, a difference of 0.14%).
| Demographics | Rating | Rank | Female Unemployment |
| Salvadorans | 0.0 /100 | #283 | Tragic 6.0% |
| Immigrants | Senegal | 0.0 /100 | #284 | Tragic 6.1% |
| Immigrants | Cabo Verde | 0.0 /100 | #285 | Tragic 6.1% |
| Chippewa | 0.0 /100 | #286 | Tragic 6.1% |
| Immigrants | Guatemala | 0.0 /100 | #287 | Tragic 6.1% |
| Haitians | 0.0 /100 | #288 | Tragic 6.1% |
| Trinidadians and Tobagonians | 0.0 /100 | #289 | Tragic 6.1% |
| Immigrants | Caribbean | 0.0 /100 | #290 | Tragic 6.1% |
| Immigrants | West Indies | 0.0 /100 | #291 | Tragic 6.1% |
| Immigrants | Trinidad and Tobago | 0.0 /100 | #292 | Tragic 6.1% |
| Mexicans | 0.0 /100 | #293 | Tragic 6.1% |
| Immigrants | El Salvador | 0.0 /100 | #294 | Tragic 6.1% |
| Immigrants | Latin America | 0.0 /100 | #295 | Tragic 6.1% |
| Alaskan Athabascans | 0.0 /100 | #296 | Tragic 6.1% |
| West Indians | 0.0 /100 | #297 | Tragic 6.1% |