Nepalese vs Burmese Unemployment Among Ages 30 to 34 years
COMPARE
Nepalese
Burmese
Unemployment Among Ages 30 to 34 years
Unemployment Among Ages 30 to 34 years Comparison
Nepalese
Burmese
5.9%
UNEMPLOYMENT AMONG AGES 30 TO 34 YEARS
0.8/ 100
METRIC RATING
233rd/ 347
METRIC RANK
5.1%
UNEMPLOYMENT AMONG AGES 30 TO 34 YEARS
96.5/ 100
METRIC RATING
67th/ 347
METRIC RANK
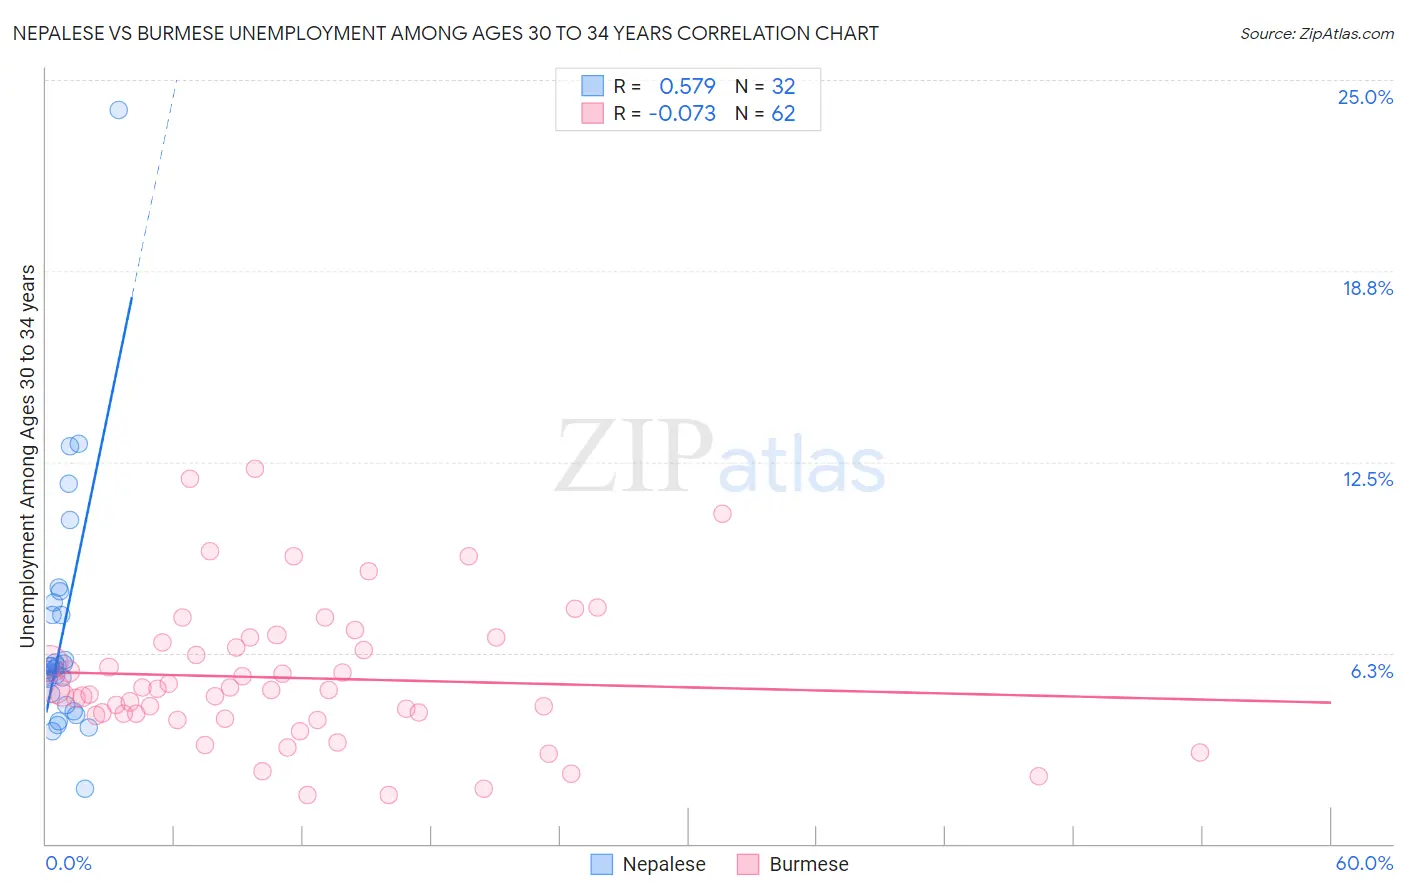
Nepalese vs Burmese Unemployment Among Ages 30 to 34 years Correlation Chart
The statistical analysis conducted on geographies consisting of 24,385,423 people shows a substantial positive correlation between the proportion of Nepalese and unemployment rate among population between the ages 30 and 34 in the United States with a correlation coefficient (R) of 0.579 and weighted average of 5.9%. Similarly, the statistical analysis conducted on geographies consisting of 431,223,716 people shows a slight negative correlation between the proportion of Burmese and unemployment rate among population between the ages 30 and 34 in the United States with a correlation coefficient (R) of -0.073 and weighted average of 5.1%, a difference of 14.9%.
Unemployment Among Ages 30 to 34 years Correlation Summary
| Measurement | Nepalese | Burmese |
| Minimum | 1.8% | 1.6% |
| Maximum | 24.0% | 12.3% |
| Range | 22.2% | 10.7% |
| Mean | 6.9% | 5.4% |
| Median | 5.8% | 5.0% |
| Interquartile 25% (IQ1) | 4.7% | 4.2% |
| Interquartile 75% (IQ3) | 7.7% | 6.6% |
| Interquartile Range (IQR) | 3.0% | 2.4% |
| Standard Deviation (Sample) | 4.1% | 2.3% |
| Standard Deviation (Population) | 4.0% | 2.3% |
Similar Demographics by Unemployment Among Ages 30 to 34 years
Demographics Similar to Nepalese by Unemployment Among Ages 30 to 34 years
In terms of unemployment among ages 30 to 34 years, the demographic groups most similar to Nepalese are Portuguese (5.9%, a difference of 0.030%), Yaqui (5.9%, a difference of 0.15%), Native Hawaiian (5.9%, a difference of 0.27%), Iroquois (5.9%, a difference of 0.38%), and Central American (5.9%, a difference of 0.44%).
| Demographics | Rating | Rank | Unemployment Among Ages 30 to 34 years |
| Liberians | 2.3 /100 | #226 | Tragic 5.8% |
| Spanish | 1.8 /100 | #227 | Tragic 5.8% |
| Immigrants | Bahamas | 1.8 /100 | #228 | Tragic 5.8% |
| Immigrants | Uzbekistan | 1.5 /100 | #229 | Tragic 5.9% |
| Hawaiians | 1.2 /100 | #230 | Tragic 5.9% |
| Japanese | 1.1 /100 | #231 | Tragic 5.9% |
| Iroquois | 1.0 /100 | #232 | Tragic 5.9% |
| Nepalese | 0.8 /100 | #233 | Tragic 5.9% |
| Portuguese | 0.8 /100 | #234 | Tragic 5.9% |
| Yaqui | 0.7 /100 | #235 | Tragic 5.9% |
| Native Hawaiians | 0.7 /100 | #236 | Tragic 5.9% |
| Central Americans | 0.6 /100 | #237 | Tragic 5.9% |
| Mexican American Indians | 0.6 /100 | #238 | Tragic 5.9% |
| Immigrants | Nigeria | 0.6 /100 | #239 | Tragic 6.0% |
| Salvadorans | 0.5 /100 | #240 | Tragic 6.0% |
Demographics Similar to Burmese by Unemployment Among Ages 30 to 34 years
In terms of unemployment among ages 30 to 34 years, the demographic groups most similar to Burmese are Jordanian (5.1%, a difference of 0.010%), Immigrants from Northern Africa (5.1%, a difference of 0.020%), Immigrants from Iraq (5.1%, a difference of 0.020%), Paraguayan (5.1%, a difference of 0.030%), and Immigrants from Moldova (5.1%, a difference of 0.040%).
| Demographics | Rating | Rank | Unemployment Among Ages 30 to 34 years |
| Immigrants | Somalia | 97.1 /100 | #60 | Exceptional 5.1% |
| Indians (Asian) | 97.0 /100 | #61 | Exceptional 5.1% |
| Immigrants | France | 97.0 /100 | #62 | Exceptional 5.1% |
| Belgians | 97.0 /100 | #63 | Exceptional 5.1% |
| Immigrants | Eastern Asia | 96.9 /100 | #64 | Exceptional 5.1% |
| Immigrants | Japan | 96.8 /100 | #65 | Exceptional 5.1% |
| Immigrants | Zimbabwe | 96.7 /100 | #66 | Exceptional 5.1% |
| Burmese | 96.5 /100 | #67 | Exceptional 5.1% |
| Jordanians | 96.5 /100 | #68 | Exceptional 5.1% |
| Immigrants | Northern Africa | 96.4 /100 | #69 | Exceptional 5.1% |
| Immigrants | Iraq | 96.4 /100 | #70 | Exceptional 5.1% |
| Paraguayans | 96.4 /100 | #71 | Exceptional 5.1% |
| Immigrants | Moldova | 96.4 /100 | #72 | Exceptional 5.1% |
| Slovenes | 96.2 /100 | #73 | Exceptional 5.2% |
| Immigrants | Asia | 96.2 /100 | #74 | Exceptional 5.2% |