Navajo vs Immigrants from Belarus Female Unemployment
COMPARE
Navajo
Immigrants from Belarus
Female Unemployment
Female Unemployment Comparison
Navajo
Immigrants from Belarus
7.3%
FEMALE UNEMPLOYMENT
0.0/ 100
METRIC RATING
337th/ 347
METRIC RANK
5.3%
FEMALE UNEMPLOYMENT
39.4/ 100
METRIC RATING
186th/ 347
METRIC RANK
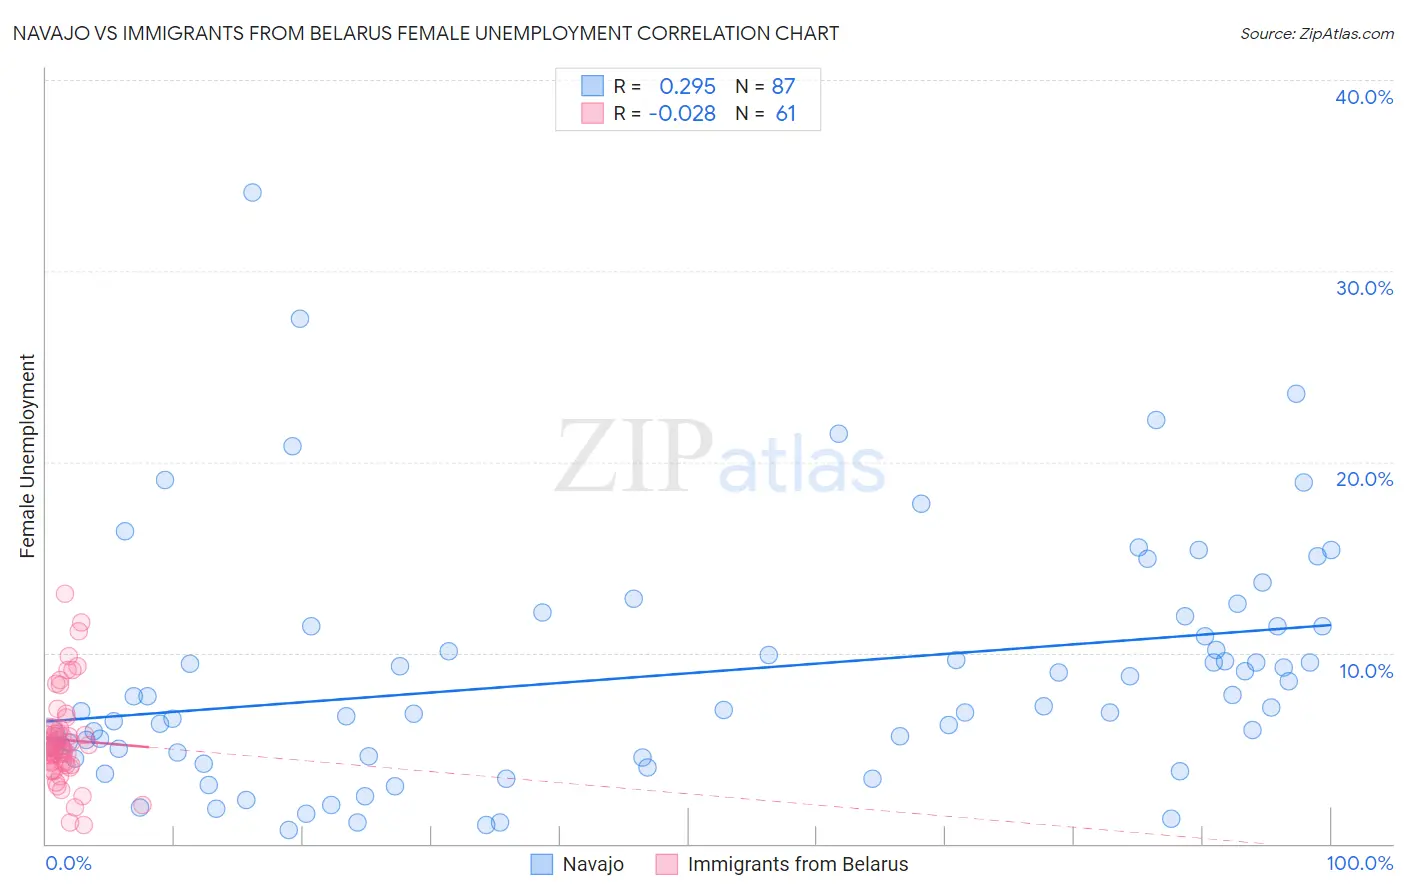
Navajo vs Immigrants from Belarus Female Unemployment Correlation Chart
The statistical analysis conducted on geographies consisting of 223,861,194 people shows a weak positive correlation between the proportion of Navajo and unemploymnet rate among females in the United States with a correlation coefficient (R) of 0.295 and weighted average of 7.3%. Similarly, the statistical analysis conducted on geographies consisting of 150,026,552 people shows no correlation between the proportion of Immigrants from Belarus and unemploymnet rate among females in the United States with a correlation coefficient (R) of -0.028 and weighted average of 5.3%, a difference of 37.7%.
Female Unemployment Correlation Summary
| Measurement | Navajo | Immigrants from Belarus |
| Minimum | 0.70% | 1.0% |
| Maximum | 34.1% | 13.1% |
| Range | 33.4% | 12.1% |
| Mean | 8.9% | 5.4% |
| Median | 7.2% | 5.0% |
| Interquartile 25% (IQ1) | 4.6% | 4.2% |
| Interquartile 75% (IQ3) | 11.4% | 6.0% |
| Interquartile Range (IQR) | 6.8% | 1.9% |
| Standard Deviation (Sample) | 6.3% | 2.4% |
| Standard Deviation (Population) | 6.2% | 2.4% |
Similar Demographics by Female Unemployment
Demographics Similar to Navajo by Female Unemployment
In terms of female unemployment, the demographic groups most similar to Navajo are Immigrants from Dominican Republic (7.2%, a difference of 0.94%), Dominican (7.2%, a difference of 1.6%), Immigrants from Armenia (7.1%, a difference of 3.0%), Menominee (7.0%, a difference of 3.5%), and Sioux (7.0%, a difference of 3.5%).
| Demographics | Rating | Rank | Female Unemployment |
| Yakama | 0.0 /100 | #330 | Tragic 6.7% |
| Paiute | 0.0 /100 | #331 | Tragic 6.8% |
| Sioux | 0.0 /100 | #332 | Tragic 7.0% |
| Menominee | 0.0 /100 | #333 | Tragic 7.0% |
| Immigrants | Armenia | 0.0 /100 | #334 | Tragic 7.1% |
| Dominicans | 0.0 /100 | #335 | Tragic 7.2% |
| Immigrants | Dominican Republic | 0.0 /100 | #336 | Tragic 7.2% |
| Navajo | 0.0 /100 | #337 | Tragic 7.3% |
| Tohono O'odham | 0.0 /100 | #338 | Tragic 7.7% |
| Immigrants | Yemen | 0.0 /100 | #339 | Tragic 7.8% |
| Hopi | 0.0 /100 | #340 | Tragic 8.1% |
| Inupiat | 0.0 /100 | #341 | Tragic 8.2% |
| Puerto Ricans | 0.0 /100 | #342 | Tragic 8.3% |
| Arapaho | 0.0 /100 | #343 | Tragic 8.8% |
| Pima | 0.0 /100 | #344 | Tragic 9.3% |
Demographics Similar to Immigrants from Belarus by Female Unemployment
In terms of female unemployment, the demographic groups most similar to Immigrants from Belarus are Malaysian (5.3%, a difference of 0.040%), Immigrants from Ukraine (5.3%, a difference of 0.050%), Immigrants from Indonesia (5.3%, a difference of 0.080%), Taiwanese (5.3%, a difference of 0.20%), and Nonimmigrants (5.3%, a difference of 0.20%).
| Demographics | Rating | Rank | Female Unemployment |
| Laotians | 45.1 /100 | #179 | Average 5.3% |
| Immigrants | Congo | 43.1 /100 | #180 | Average 5.3% |
| Taiwanese | 42.7 /100 | #181 | Average 5.3% |
| Immigrants | Nonimmigrants | 42.6 /100 | #182 | Average 5.3% |
| Immigrants | Indonesia | 40.7 /100 | #183 | Average 5.3% |
| Immigrants | Ukraine | 40.1 /100 | #184 | Average 5.3% |
| Malaysians | 40.1 /100 | #185 | Average 5.3% |
| Immigrants | Belarus | 39.4 /100 | #186 | Fair 5.3% |
| Immigrants | Albania | 35.4 /100 | #187 | Fair 5.3% |
| Afghans | 33.9 /100 | #188 | Fair 5.3% |
| Costa Ricans | 33.8 /100 | #189 | Fair 5.3% |
| Ugandans | 31.2 /100 | #190 | Fair 5.3% |
| Cherokee | 30.8 /100 | #191 | Fair 5.3% |
| Portuguese | 28.6 /100 | #192 | Fair 5.3% |
| Arabs | 27.7 /100 | #193 | Fair 5.3% |