Navajo vs Chippewa Unemployment Among Ages 16 to 19 years
COMPARE
Navajo
Chippewa
Unemployment Among Ages 16 to 19 years
Unemployment Among Ages 16 to 19 years Comparison
Navajo
Chippewa
29.0%
UNEMPLOYMENT AMONG AGES 16 TO 19 YEARS
0.0/ 100
METRIC RATING
343rd/ 347
METRIC RANK
18.0%
UNEMPLOYMENT AMONG AGES 16 TO 19 YEARS
13.7/ 100
METRIC RATING
213th/ 347
METRIC RANK
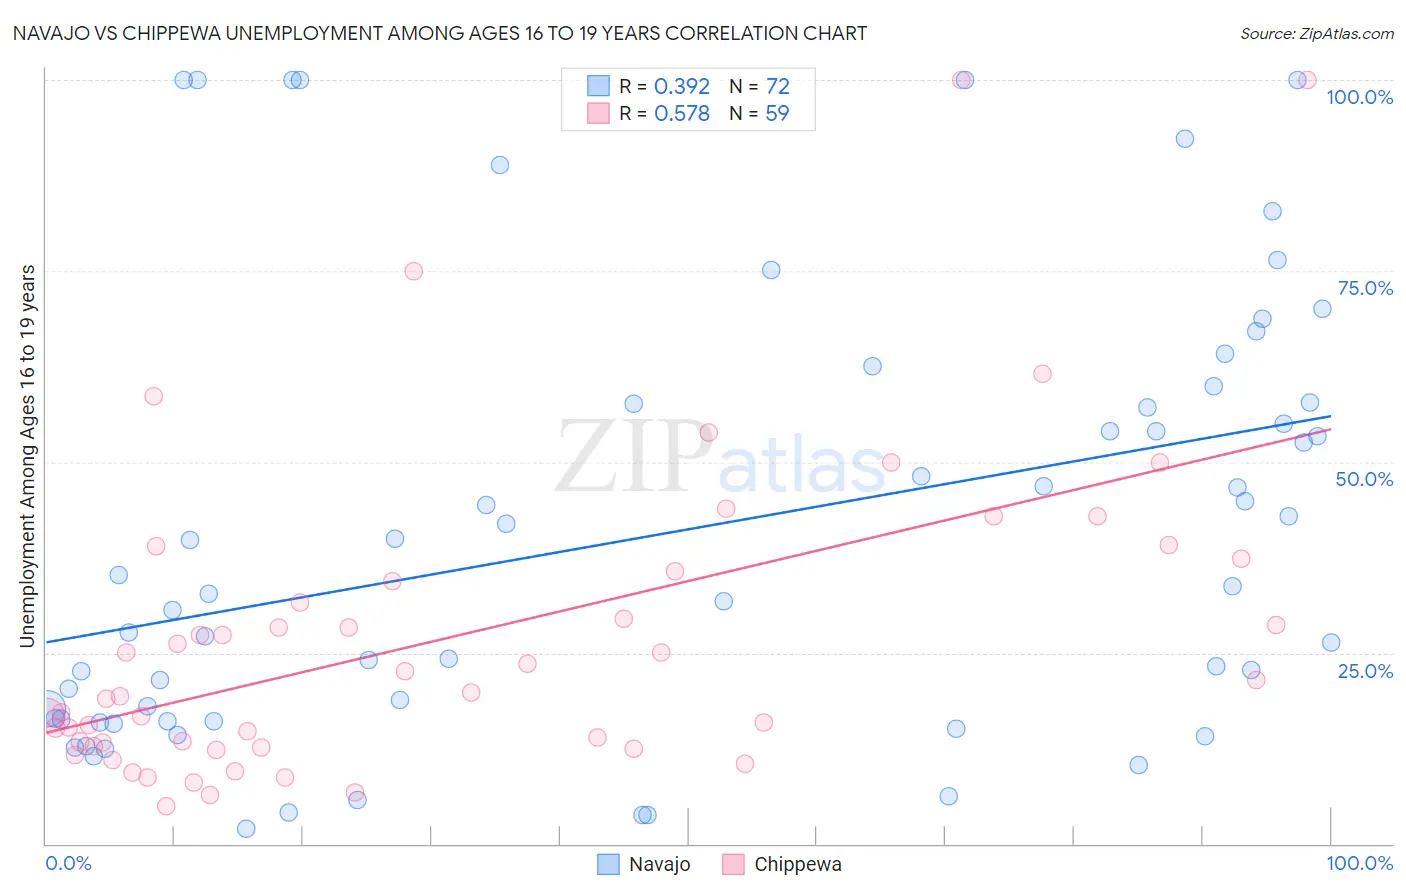
Navajo vs Chippewa Unemployment Among Ages 16 to 19 years Correlation Chart
The statistical analysis conducted on geographies consisting of 218,309,050 people shows a mild positive correlation between the proportion of Navajo and unemployment rate among population between the ages 16 and 19 in the United States with a correlation coefficient (R) of 0.392 and weighted average of 29.0%. Similarly, the statistical analysis conducted on geographies consisting of 207,549,693 people shows a substantial positive correlation between the proportion of Chippewa and unemployment rate among population between the ages 16 and 19 in the United States with a correlation coefficient (R) of 0.578 and weighted average of 18.0%, a difference of 61.7%.
Unemployment Among Ages 16 to 19 years Correlation Summary
| Measurement | Navajo | Chippewa |
| Minimum | 1.9% | 4.9% |
| Maximum | 100.0% | 100.0% |
| Range | 98.1% | 95.1% |
| Mean | 40.7% | 27.0% |
| Median | 33.3% | 19.7% |
| Interquartile 25% (IQ1) | 16.2% | 12.7% |
| Interquartile 75% (IQ3) | 57.7% | 35.6% |
| Interquartile Range (IQR) | 41.5% | 22.9% |
| Standard Deviation (Sample) | 28.7% | 20.7% |
| Standard Deviation (Population) | 28.5% | 20.5% |
Similar Demographics by Unemployment Among Ages 16 to 19 years
Demographics Similar to Navajo by Unemployment Among Ages 16 to 19 years
In terms of unemployment among ages 16 to 19 years, the demographic groups most similar to Navajo are Colville (29.7%, a difference of 2.2%), Inupiat (28.1%, a difference of 3.5%), Hopi (30.7%, a difference of 5.6%), Puerto Rican (27.5%, a difference of 5.6%), and Crow (26.2%, a difference of 10.7%).
| Demographics | Rating | Rank | Unemployment Among Ages 16 to 19 years |
| Paiute | 0.0 /100 | #333 | Tragic 24.4% |
| Guyanese | 0.0 /100 | #334 | Tragic 24.8% |
| Arapaho | 0.0 /100 | #335 | Tragic 25.2% |
| Kiowa | 0.0 /100 | #336 | Tragic 25.2% |
| Immigrants | Guyana | 0.0 /100 | #337 | Tragic 25.5% |
| Immigrants | St. Vincent and the Grenadines | 0.0 /100 | #338 | Tragic 25.7% |
| Immigrants | Grenada | 0.0 /100 | #339 | Tragic 25.7% |
| Crow | 0.0 /100 | #340 | Tragic 26.2% |
| Puerto Ricans | 0.0 /100 | #341 | Tragic 27.5% |
| Inupiat | 0.0 /100 | #342 | Tragic 28.1% |
| Navajo | 0.0 /100 | #343 | Tragic 29.0% |
| Colville | 0.0 /100 | #344 | Tragic 29.7% |
| Hopi | 0.0 /100 | #345 | Tragic 30.7% |
| Yuman | 0.0 /100 | #346 | Tragic 37.4% |
| Yup'ik | 0.0 /100 | #347 | Tragic 41.0% |
Demographics Similar to Chippewa by Unemployment Among Ages 16 to 19 years
In terms of unemployment among ages 16 to 19 years, the demographic groups most similar to Chippewa are Argentinean (18.0%, a difference of 0.010%), Immigrants from Morocco (18.0%, a difference of 0.020%), Immigrants from Syria (18.0%, a difference of 0.040%), Guamanian/Chamorro (17.9%, a difference of 0.070%), and Immigrants from Kazakhstan (18.0%, a difference of 0.080%).
| Demographics | Rating | Rank | Unemployment Among Ages 16 to 19 years |
| Immigrants | Southern Europe | 18.9 /100 | #206 | Poor 17.9% |
| Liberians | 18.6 /100 | #207 | Poor 17.9% |
| Hawaiians | 16.8 /100 | #208 | Poor 17.9% |
| Cherokee | 15.7 /100 | #209 | Poor 17.9% |
| Carpatho Rusyns | 15.6 /100 | #210 | Poor 17.9% |
| Guamanians/Chamorros | 14.5 /100 | #211 | Poor 17.9% |
| Argentineans | 13.8 /100 | #212 | Poor 18.0% |
| Chippewa | 13.7 /100 | #213 | Poor 18.0% |
| Immigrants | Morocco | 13.5 /100 | #214 | Poor 18.0% |
| Immigrants | Syria | 13.3 /100 | #215 | Poor 18.0% |
| Immigrants | Kazakhstan | 13.0 /100 | #216 | Poor 18.0% |
| South American Indians | 13.0 /100 | #217 | Poor 18.0% |
| Immigrants | Argentina | 12.5 /100 | #218 | Poor 18.0% |
| Immigrants | Africa | 12.0 /100 | #219 | Poor 18.0% |
| Immigrants | Albania | 11.4 /100 | #220 | Poor 18.0% |