Navajo vs Bahamian Unemployment Among Ages 45 to 54 years
COMPARE
Navajo
Bahamian
Unemployment Among Ages 45 to 54 years
Unemployment Among Ages 45 to 54 years Comparison
Navajo
Bahamians
6.7%
UNEMPLOYMENT AMONG AGES 45 TO 54 YEARS
0.0/ 100
METRIC RATING
335th/ 347
METRIC RANK
4.9%
UNEMPLOYMENT AMONG AGES 45 TO 54 YEARS
0.0/ 100
METRIC RATING
267th/ 347
METRIC RANK
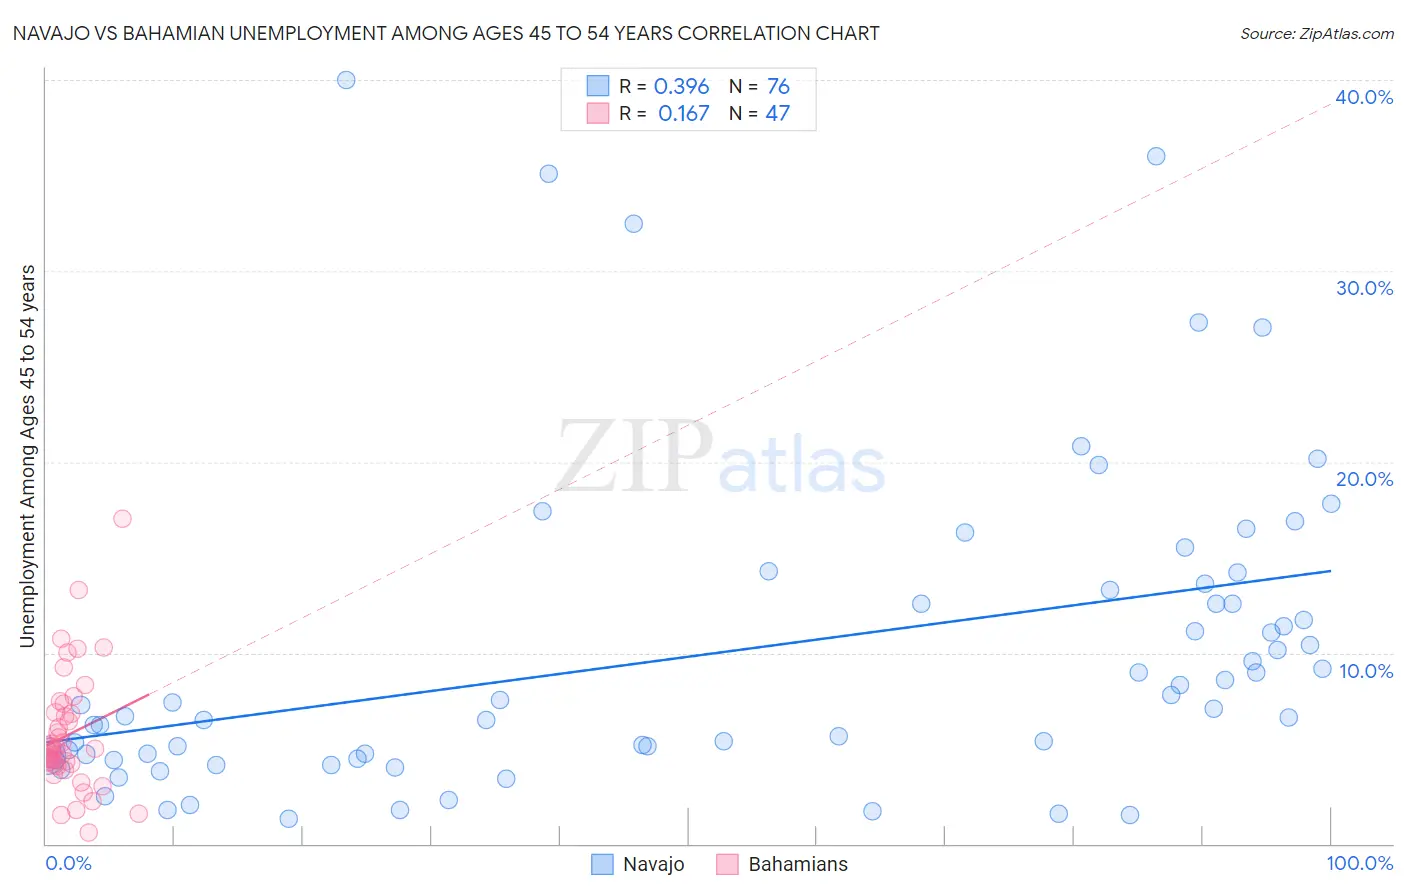
Navajo vs Bahamian Unemployment Among Ages 45 to 54 years Correlation Chart
The statistical analysis conducted on geographies consisting of 220,825,201 people shows a mild positive correlation between the proportion of Navajo and unemployment rate among population between the ages 45 and 54 in the United States with a correlation coefficient (R) of 0.396 and weighted average of 6.7%. Similarly, the statistical analysis conducted on geographies consisting of 111,522,631 people shows a poor positive correlation between the proportion of Bahamians and unemployment rate among population between the ages 45 and 54 in the United States with a correlation coefficient (R) of 0.167 and weighted average of 4.9%, a difference of 34.9%.
Unemployment Among Ages 45 to 54 years Correlation Summary
| Measurement | Navajo | Bahamian |
| Minimum | 1.3% | 0.60% |
| Maximum | 40.0% | 17.0% |
| Range | 38.7% | 16.4% |
| Mean | 10.1% | 5.7% |
| Median | 7.2% | 5.0% |
| Interquartile 25% (IQ1) | 4.5% | 4.1% |
| Interquartile 75% (IQ3) | 13.0% | 6.9% |
| Interquartile Range (IQR) | 8.4% | 2.7% |
| Standard Deviation (Sample) | 8.5% | 3.1% |
| Standard Deviation (Population) | 8.4% | 3.1% |
Similar Demographics by Unemployment Among Ages 45 to 54 years
Demographics Similar to Navajo by Unemployment Among Ages 45 to 54 years
In terms of unemployment among ages 45 to 54 years, the demographic groups most similar to Navajo are Sioux (6.6%, a difference of 0.48%), Immigrants from Yemen (6.5%, a difference of 1.5%), Puerto Rican (6.8%, a difference of 2.2%), Pima (6.4%, a difference of 3.3%), and Apache (7.0%, a difference of 5.6%).
| Demographics | Rating | Rank | Unemployment Among Ages 45 to 54 years |
| Pueblo | 0.0 /100 | #328 | Tragic 6.2% |
| Alaska Natives | 0.0 /100 | #329 | Tragic 6.3% |
| Immigrants | Dominican Republic | 0.0 /100 | #330 | Tragic 6.3% |
| Tohono O'odham | 0.0 /100 | #331 | Tragic 6.3% |
| Pima | 0.0 /100 | #332 | Tragic 6.4% |
| Immigrants | Yemen | 0.0 /100 | #333 | Tragic 6.5% |
| Sioux | 0.0 /100 | #334 | Tragic 6.6% |
| Navajo | 0.0 /100 | #335 | Tragic 6.7% |
| Puerto Ricans | 0.0 /100 | #336 | Tragic 6.8% |
| Apache | 0.0 /100 | #337 | Tragic 7.0% |
| Colville | 0.0 /100 | #338 | Tragic 7.4% |
| Arapaho | 0.0 /100 | #339 | Tragic 7.5% |
| Hopi | 0.0 /100 | #340 | Tragic 7.5% |
| Paiute | 0.0 /100 | #341 | Tragic 7.8% |
| Alaskan Athabascans | 0.0 /100 | #342 | Tragic 8.5% |
Demographics Similar to Bahamians by Unemployment Among Ages 45 to 54 years
In terms of unemployment among ages 45 to 54 years, the demographic groups most similar to Bahamians are Ghanaian (4.9%, a difference of 0.090%), Immigrants from Uzbekistan (4.9%, a difference of 0.090%), Immigrants from Somalia (4.9%, a difference of 0.21%), Somali (5.0%, a difference of 0.47%), and Immigrants from Guatemala (4.9%, a difference of 0.48%).
| Demographics | Rating | Rank | Unemployment Among Ages 45 to 54 years |
| Mexican American Indians | 0.1 /100 | #260 | Tragic 4.9% |
| Guatemalans | 0.1 /100 | #261 | Tragic 4.9% |
| Mexicans | 0.1 /100 | #262 | Tragic 4.9% |
| Immigrants | Fiji | 0.1 /100 | #263 | Tragic 4.9% |
| Immigrants | Guatemala | 0.1 /100 | #264 | Tragic 4.9% |
| Immigrants | Somalia | 0.1 /100 | #265 | Tragic 4.9% |
| Ghanaians | 0.0 /100 | #266 | Tragic 4.9% |
| Bahamians | 0.0 /100 | #267 | Tragic 4.9% |
| Immigrants | Uzbekistan | 0.0 /100 | #268 | Tragic 4.9% |
| Somalis | 0.0 /100 | #269 | Tragic 5.0% |
| Immigrants | Ghana | 0.0 /100 | #270 | Tragic 5.0% |
| Cajuns | 0.0 /100 | #271 | Tragic 5.0% |
| Immigrants | Central America | 0.0 /100 | #272 | Tragic 5.0% |
| Immigrants | Latin America | 0.0 /100 | #273 | Tragic 5.0% |
| U.S. Virgin Islanders | 0.0 /100 | #274 | Tragic 5.0% |