Navajo vs Argentinean Unemployment Among Seniors over 65 years
COMPARE
Navajo
Argentinean
Unemployment Among Seniors over 65 years
Unemployment Among Seniors over 65 years Comparison
Navajo
Argentineans
6.7%
UNEMPLOYMENT AMONG SENIORS OVER 65 YEARS
0.0/ 100
METRIC RATING
342nd/ 347
METRIC RANK
5.2%
UNEMPLOYMENT AMONG SENIORS OVER 65 YEARS
29.1/ 100
METRIC RATING
194th/ 347
METRIC RANK
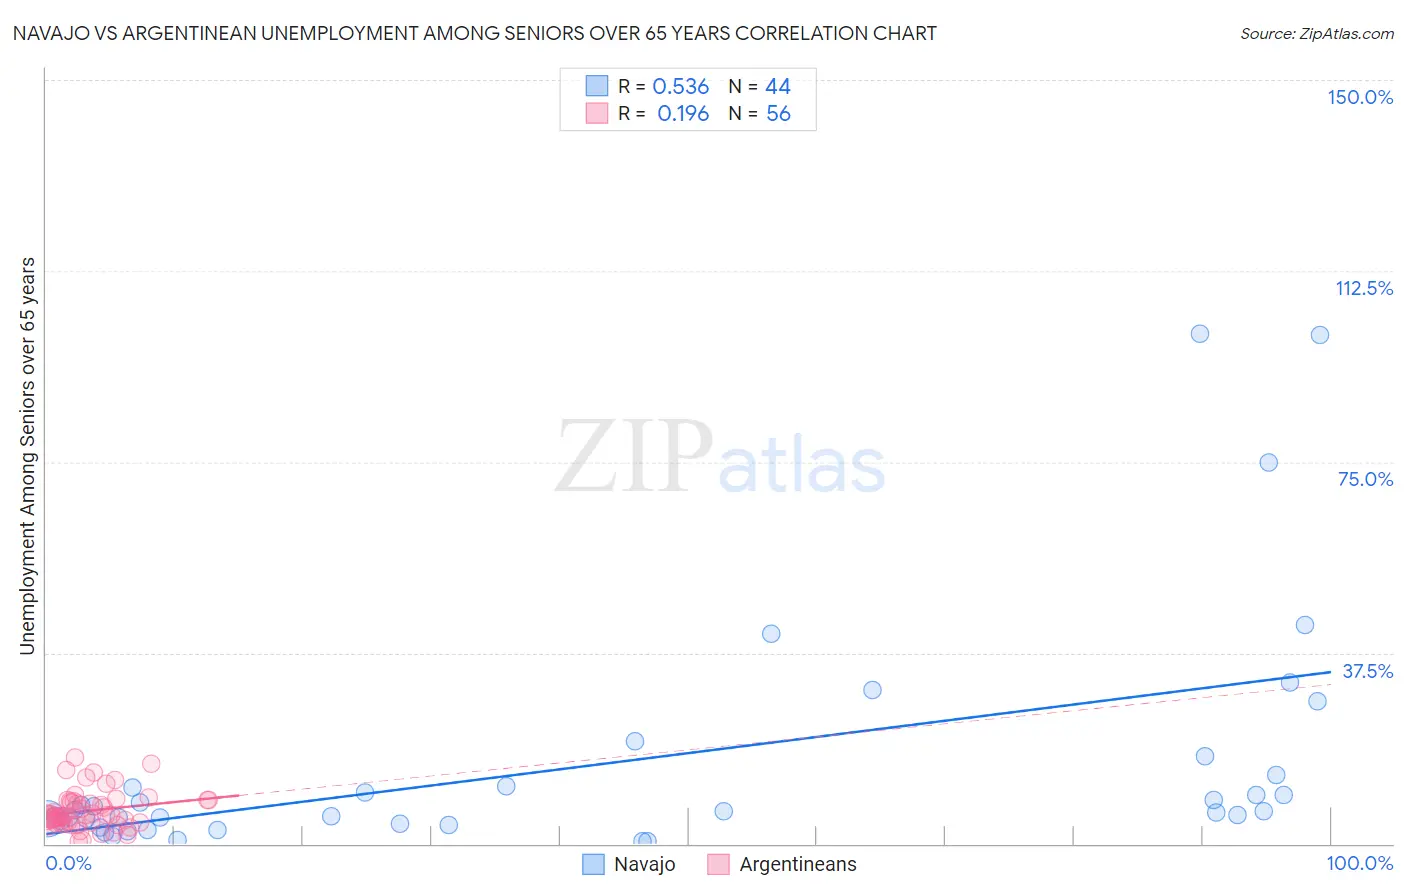
Navajo vs Argentinean Unemployment Among Seniors over 65 years Correlation Chart
The statistical analysis conducted on geographies consisting of 207,679,315 people shows a substantial positive correlation between the proportion of Navajo and unemployment rate amomg seniors over the age of 65 in the United States with a correlation coefficient (R) of 0.536 and weighted average of 6.7%. Similarly, the statistical analysis conducted on geographies consisting of 277,763,144 people shows a poor positive correlation between the proportion of Argentineans and unemployment rate amomg seniors over the age of 65 in the United States with a correlation coefficient (R) of 0.196 and weighted average of 5.2%, a difference of 29.3%.
Unemployment Among Seniors over 65 years Correlation Summary
| Measurement | Navajo | Argentinean |
| Minimum | 0.50% | 0.40% |
| Maximum | 100.1% | 17.0% |
| Range | 99.6% | 16.6% |
| Mean | 15.4% | 6.5% |
| Median | 6.4% | 5.4% |
| Interquartile 25% (IQ1) | 4.3% | 4.2% |
| Interquartile 75% (IQ3) | 12.3% | 8.4% |
| Interquartile Range (IQR) | 8.1% | 4.2% |
| Standard Deviation (Sample) | 23.4% | 3.6% |
| Standard Deviation (Population) | 23.1% | 3.6% |
Similar Demographics by Unemployment Among Seniors over 65 years
Demographics Similar to Navajo by Unemployment Among Seniors over 65 years
In terms of unemployment among seniors over 65 years, the demographic groups most similar to Navajo are Yakama (6.7%, a difference of 0.45%), Tlingit-Haida (6.8%, a difference of 1.3%), Alaskan Athabascan (7.0%, a difference of 5.1%), Ute (6.3%, a difference of 5.9%), and Paiute (6.3%, a difference of 5.9%).
| Demographics | Rating | Rank | Unemployment Among Seniors over 65 years |
| Immigrants | Dominican Republic | 0.0 /100 | #333 | Tragic 6.0% |
| Tohono O'odham | 0.0 /100 | #334 | Tragic 6.1% |
| Immigrants | Armenia | 0.0 /100 | #335 | Tragic 6.2% |
| Pima | 0.0 /100 | #336 | Tragic 6.3% |
| Alaska Natives | 0.0 /100 | #337 | Tragic 6.3% |
| Immigrants | Azores | 0.0 /100 | #338 | Tragic 6.3% |
| Paiute | 0.0 /100 | #339 | Tragic 6.3% |
| Ute | 0.0 /100 | #340 | Tragic 6.3% |
| Yakama | 0.0 /100 | #341 | Tragic 6.7% |
| Navajo | 0.0 /100 | #342 | Tragic 6.7% |
| Tlingit-Haida | 0.0 /100 | #343 | Tragic 6.8% |
| Alaskan Athabascans | 0.0 /100 | #344 | Tragic 7.0% |
| Immigrants | Yemen | 0.0 /100 | #345 | Tragic 8.2% |
| Yup'ik | 0.0 /100 | #346 | Tragic 9.1% |
| Crow | 0.0 /100 | #347 | Tragic 16.9% |
Demographics Similar to Argentineans by Unemployment Among Seniors over 65 years
In terms of unemployment among seniors over 65 years, the demographic groups most similar to Argentineans are Immigrants from Africa (5.2%, a difference of 0.020%), Immigrants from Denmark (5.2%, a difference of 0.070%), Sioux (5.2%, a difference of 0.070%), Costa Rican (5.2%, a difference of 0.080%), and Korean (5.2%, a difference of 0.090%).
| Demographics | Rating | Rank | Unemployment Among Seniors over 65 years |
| Somalis | 33.5 /100 | #187 | Fair 5.2% |
| Immigrants | Egypt | 33.2 /100 | #188 | Fair 5.2% |
| Bangladeshis | 32.3 /100 | #189 | Fair 5.2% |
| Koreans | 31.6 /100 | #190 | Fair 5.2% |
| Immigrants | Denmark | 31.0 /100 | #191 | Fair 5.2% |
| Sioux | 30.8 /100 | #192 | Fair 5.2% |
| Immigrants | Africa | 29.6 /100 | #193 | Fair 5.2% |
| Argentineans | 29.1 /100 | #194 | Fair 5.2% |
| Costa Ricans | 27.0 /100 | #195 | Fair 5.2% |
| Immigrants | Poland | 24.3 /100 | #196 | Fair 5.2% |
| Guamanians/Chamorros | 22.5 /100 | #197 | Fair 5.2% |
| Maltese | 19.6 /100 | #198 | Poor 5.2% |
| Immigrants | Europe | 19.0 /100 | #199 | Poor 5.2% |
| Immigrants | Pakistan | 18.4 /100 | #200 | Poor 5.2% |
| Laotians | 18.1 /100 | #201 | Poor 5.2% |