Native/Alaskan vs Tlingit-Haida Unemployment Among Ages 20 to 24 years

COMPARE

Native/Alaskan
Race
Ancestry
AfghanAfricanAlaska NativeAlaskan AthabascanAlbanianAleutAlsatianAmericanApacheArabArapahoArgentineanArmenianAssyrian/Chaldean/SyriacAustralianAustrianBahamianBangladeshiBarbadianBasqueBelgianBelizeanBermudanBhutaneseBlackfeetBolivianBrazilianBritishBritish West IndianBulgarianBurmeseCajunCambodianCanadianCape VerdeanCarpatho RusynCelticCentral AmericanCentral American IndianCherokeeCheyenneChickasawChileanChineseChippewaChoctawColombianColvilleComancheCosta RicanCreeCreekCroatianCrowCubanCypriotCzechCzechoslovakianDanishDelawareDominicanDutchDutch West IndianEastern EuropeanEcuadorianEgyptianEnglishEstonianEthiopianEuropeanFijianFilipinoFinnishFrenchFrench American IndianFrench CanadianGermanGerman RussianGhanaianGreekGuamanian/ChamorroGuatemalanGuyaneseHaitianHmongHonduranHopiHoumaHungarianIcelanderIndian (Asian)IndonesianInupiatIranianIraqiIrishIroquoisIsraeliItalianJamaicanJapaneseJordanianKenyanKiowaKoreanLaotianLatvianLebaneseLiberianLithuanianLumbeeLuxembourgerMacedonianMalaysianMalteseMarshalleseMenomineeMexicanMexican American IndianMongolianMoroccanNative HawaiianNavajoNepaleseNew ZealanderNicaraguanNigerianNorthern EuropeanNorwegianOkinawanOsageOttawaPaiutePakistaniPalestinianPanamanianParaguayanPennsylvania GermanPeruvianPimaPolishPortuguesePotawatomiPuebloPuerto RicanPuget Sound SalishRomanianRussianSalvadoranSamoanScandinavianScotch-IrishScottishSeminoleSenegaleseSerbianShoshoneSierra LeoneanSiouxSlavicSlovakSloveneSomaliSouth AfricanSouth AmericanSouth American IndianSoviet UnionSpaniardSpanishSpanish AmericanSpanish American IndianSri LankanSubsaharan AfricanSudaneseSwedishSwissSyrianTaiwaneseThaiTohono O'OdhamTonganTrinidadian and TobagonianTsimshianTurkishU.S. Virgin IslanderUgandanUkrainianUruguayanUteVenezuelanVietnameseWelshWest IndianYakamaYaquiYugoslavianYumanYup'ikZimbabwean
Immigration
NonimmigrantsImmigrantsAfghanistanAfricaAlbaniaArgentinaArmeniaAsiaAustraliaAustriaBahamasBangladeshBarbadosBelarusBelgiumBelizeBoliviaBosnia and HerzegovinaBrazilBulgariaBurma/MyanmarCabo VerdeCambodiaCameroonCanadaCaribbeanCentral AmericaChileChinaColombiaCongoCosta RicaCroatiaCubaCzechoslovakiaDenmarkDominicaDominican RepublicEastern AfricaEastern AsiaEastern EuropeEcuadorEgyptEl SalvadorEnglandEritreaEthiopiaEuropeFijiFranceGermanyGhanaGreeceGrenadaGuatemalaGuyanaHaitiHondurasHong KongHungaryIndiaIndonesiaIranIraqIrelandIsraelItalyJamaicaJapanJordanKazakhstanKenyaKoreaKuwaitLaosLatin AmericaLatviaLebanonLiberiaLithuaniaMalaysiaMexicoMicronesiaMiddle AfricaMoldovaMoroccoNepalNetherlandsNicaraguaNigeriaNorth AmericaNorth MacedoniaNorthern AfricaNorthern EuropeNorwayOceaniaPakistanPanamaPeruPhilippinesPolandPortugalRomaniaRussiaSaudi ArabiaScotlandSenegalSerbiaSierra LeoneSingaporeSomaliaSouth AfricaSouth AmericaSouth Central AsiaSouth Eastern AsiaSouthern EuropeSpainSri LankaSt. Vincent and the GrenadinesSudanSwedenSwitzerlandSyriaTaiwanThailandTrinidad and TobagoTurkeyUgandaUkraineUruguayUzbekistanVenezuelaVietnamWest IndiesWestern AfricaWestern AsiaWestern EuropeYemenZaireZimbabweAzores
Tlingit-Haida
Race
Ancestry
AfghanAfricanAlaska NativeAlaskan AthabascanAlbanianAleutAlsatianAmericanApacheArabArapahoArgentineanArmenianAssyrian/Chaldean/SyriacAustralianAustrianBahamianBangladeshiBarbadianBasqueBelgianBelizeanBermudanBhutaneseBlackfeetBolivianBrazilianBritishBritish West IndianBulgarianBurmeseCajunCambodianCanadianCape VerdeanCarpatho RusynCelticCentral AmericanCentral American IndianCherokeeCheyenneChickasawChileanChineseChippewaChoctawColombianColvilleComancheCosta RicanCreeCreekCroatianCrowCubanCypriotCzechCzechoslovakianDanishDelawareDominicanDutchDutch West IndianEastern EuropeanEcuadorianEgyptianEnglishEstonianEthiopianEuropeanFijianFilipinoFinnishFrenchFrench American IndianFrench CanadianGermanGerman RussianGhanaianGreekGuamanian/ChamorroGuatemalanGuyaneseHaitianHmongHonduranHopiHoumaHungarianIcelanderIndian (Asian)IndonesianInupiatIranianIraqiIrishIroquoisIsraeliItalianJamaicanJapaneseJordanianKenyanKiowaKoreanLaotianLatvianLebaneseLiberianLithuanianLumbeeLuxembourgerMacedonianMalaysianMalteseMarshalleseMenomineeMexicanMexican American IndianMongolianMoroccanNative HawaiianNavajoNepaleseNew ZealanderNicaraguanNigerianNorthern EuropeanNorwegianOkinawanOsageOttawaPaiutePakistaniPalestinianPanamanianParaguayanPennsylvania GermanPeruvianPimaPolishPortuguesePotawatomiPuebloPuerto RicanPuget Sound SalishRomanianRussianSalvadoranSamoanScandinavianScotch-IrishScottishSeminoleSenegaleseSerbianShoshoneSierra LeoneanSiouxSlavicSlovakSloveneSomaliSouth AfricanSouth AmericanSouth American IndianSoviet UnionSpaniardSpanishSpanish AmericanSpanish American IndianSri LankanSubsaharan AfricanSudaneseSwedishSwissSyrianTaiwaneseThaiTlingit-HaidaTohono O'OdhamTonganTrinidadian and TobagonianTsimshianTurkishU.S. Virgin IslanderUgandanUkrainianUruguayanUteVenezuelanVietnameseWelshWest IndianYakamaYaquiYugoslavianYumanYup'ikZimbabwean
Immigration
NonimmigrantsImmigrantsAfghanistanAfricaAlbaniaArgentinaArmeniaAsiaAustraliaAustriaBahamasBangladeshBarbadosBelarusBelgiumBelizeBoliviaBosnia and HerzegovinaBrazilBulgariaBurma/MyanmarCabo VerdeCambodiaCameroonCanadaCaribbeanCentral AmericaChileChinaColombiaCongoCosta RicaCroatiaCubaCzechoslovakiaDenmarkDominicaDominican RepublicEastern AfricaEastern AsiaEastern EuropeEcuadorEgyptEl SalvadorEnglandEritreaEthiopiaEuropeFijiFranceGermanyGhanaGreeceGrenadaGuatemalaGuyanaHaitiHondurasHong KongHungaryIndiaIndonesiaIranIraqIrelandIsraelItalyJamaicaJapanJordanKazakhstanKenyaKoreaKuwaitLaosLatin AmericaLatviaLebanonLiberiaLithuaniaMalaysiaMexicoMicronesiaMiddle AfricaMoldovaMoroccoNepalNetherlandsNicaraguaNigeriaNorth AmericaNorth MacedoniaNorthern AfricaNorthern EuropeNorwayOceaniaPakistanPanamaPeruPhilippinesPolandPortugalRomaniaRussiaSaudi ArabiaScotlandSenegalSerbiaSierra LeoneSingaporeSomaliaSouth AfricaSouth AmericaSouth Central AsiaSouth Eastern AsiaSouthern EuropeSpainSri LankaSt. Vincent and the GrenadinesSudanSwedenSwitzerlandSyriaTaiwanThailandTrinidad and TobagoTurkeyUgandaUkraineUruguayUzbekistanVenezuelaVietnamWest IndiesWestern AfricaWestern AsiaWestern EuropeYemenZaireZimbabweAzores
Unemployment Among Ages 20 to 24 years
Income
Poverty
Unemployment
Labor Participation
Family Structure
Vehicle Availability
Education Level
Disability

Unemployment Among Ages 20 to 24 years Comparison

Natives/Alaskans

Tlingit-Haida

Tragic
Fair
13.0%
UNEMPLOYMENT AMONG AGES 20 TO 24 YEARS
0.0/ 100
METRIC RATING
322nd/ 347
METRIC RANK
10.3%
UNEMPLOYMENT AMONG AGES 20 TO 24 YEARS
39.7/ 100
METRIC RATING
179th/ 347
METRIC RANK

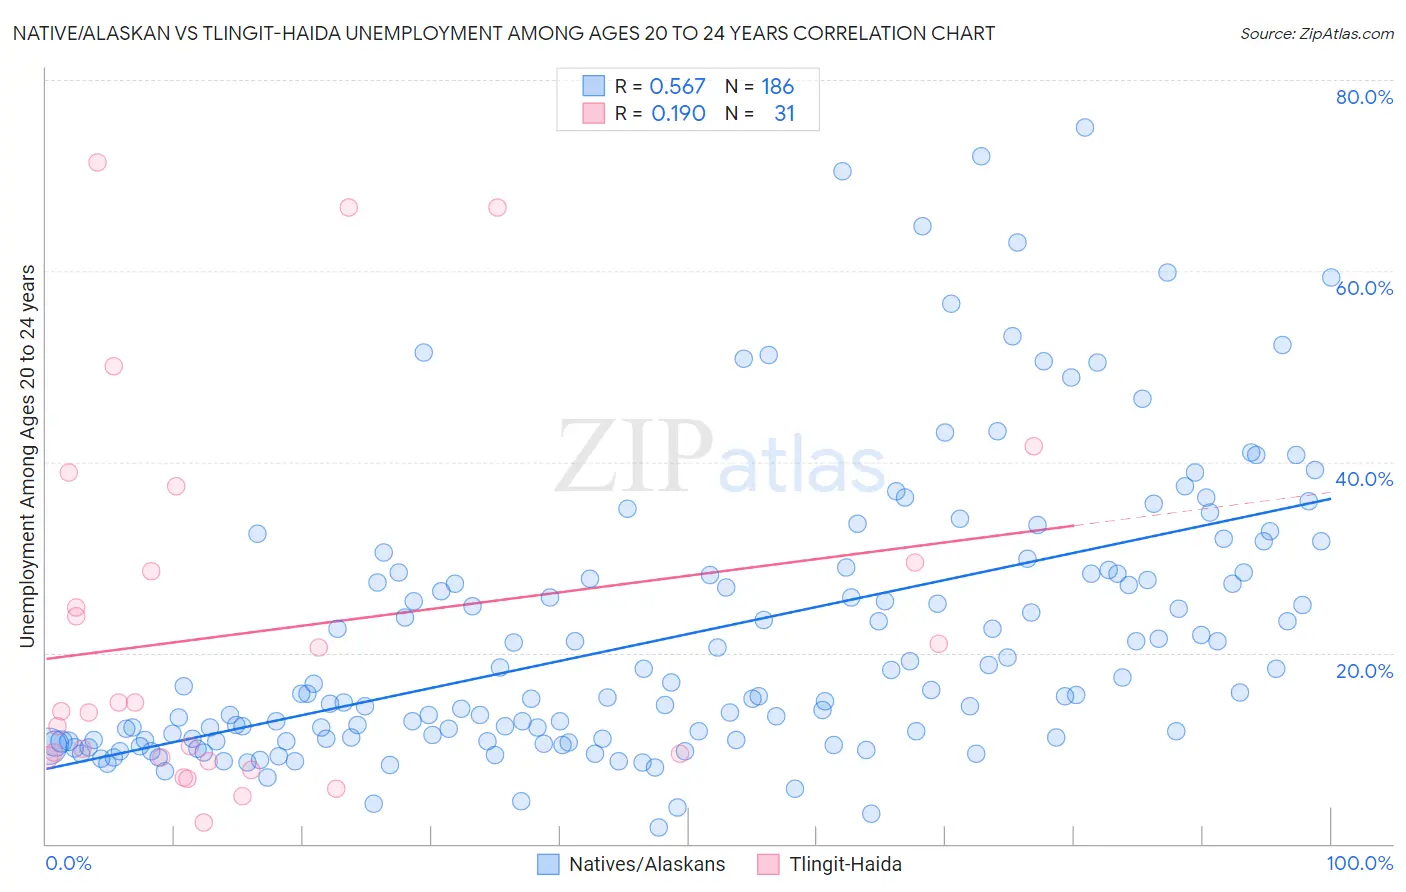
Native/Alaskan vs Tlingit-Haida Unemployment Among Ages 20 to 24 years Correlation Chart

The statistical analysis conducted on geographies consisting of 484,471,269 people shows a substantial positive correlation between the proportion of Natives/Alaskans and unemployment rate among population between the ages 20 and 24 in the United States with a correlation coefficient (R) of 0.567 and weighted average of 13.0%. Similarly, the statistical analysis conducted on geographies consisting of 60,175,372 people shows a poor positive correlation between the proportion of Tlingit-Haida and unemployment rate among population between the ages 20 and 24 in the United States with a correlation coefficient (R) of 0.190 and weighted average of 10.3%, a difference of 25.8%.
Native/Alaskan vs Tlingit-Haida Unemployment Among Ages 20 to 24 years

Unemployment Among Ages 20 to 24 years Correlation Summary

MeasurementNative/AlaskanTlingit-Haida
Minimum1.8%2.2%
Maximum75.0%71.4%
Range73.2%69.2%
Mean21.9%22.3%
Median15.7%13.9%
Interquartile 25% (IQ1)10.9%9.0%
Interquartile 75% (IQ3)28.3%29.4%
Interquartile Range (IQR)17.5%20.4%
Standard Deviation (Sample)14.8%19.4%
Standard Deviation (Population)14.8%19.1%

Similar Demographics by Unemployment Among Ages 20 to 24 years

Demographics Similar to Natives/Alaskans by Unemployment Among Ages 20 to 24 years

In terms of unemployment among ages 20 to 24 years, the demographic groups most similar to Natives/Alaskans are Immigrants from Jamaica (13.0%, a difference of 0.38%), Cheyenne (13.0%, a difference of 0.47%), Yakama (13.1%, a difference of 0.48%), Trinidadian and Tobagonian (12.9%, a difference of 0.89%), and Barbadian (12.9%, a difference of 1.1%).
DemographicsRating | RankUnemployment Among Ages 20 to 24 years
West Indians
0.0
/100
|
#315
Tragic
12.8%
Immigrants | Dominica
0.0
/100
|
#316
Tragic
12.8%
Immigrants | Trinidad and Tobago
0.0
/100
|
#317
Tragic
12.8%
Barbadians
0.0
/100
|
#318
Tragic
12.9%
Trinidadians and Tobagonians
0.0
/100
|
#319
Tragic
12.9%
Cheyenne
0.0
/100
|
#320
Tragic
13.0%
Immigrants | Jamaica
0.0
/100
|
#321
Tragic
13.0%
Natives/Alaskans
0.0
/100
|
#322
Tragic
13.0%
Yakama
0.0
/100
|
#323
Tragic
13.1%
Alaska Natives
0.0
/100
|
#324
Tragic
13.2%
Pueblo
0.0
/100
|
#325
Tragic
13.2%
Immigrants | Barbados
0.0
/100
|
#326
Tragic
13.5%
Immigrants | Dominican Republic
0.0
/100
|
#327
Tragic
13.6%
British West Indians
0.0
/100
|
#328
Tragic
13.7%
Dominicans
0.0
/100
|
#329
Tragic
13.8%

Demographics Similar to Tlingit-Haida by Unemployment Among Ages 20 to 24 years

In terms of unemployment among ages 20 to 24 years, the demographic groups most similar to Tlingit-Haida are Immigrants from Turkey (10.3%, a difference of 0.010%), Okinawan (10.3%, a difference of 0.020%), Alsatian (10.3%, a difference of 0.030%), Immigrants from Czechoslovakia (10.3%, a difference of 0.040%), and Immigrants from Germany (10.4%, a difference of 0.060%).
DemographicsRating | RankUnemployment Among Ages 20 to 24 years
Koreans
51.9
/100
|
#172
Average
10.3%
Immigrants | Sweden
50.8
/100
|
#173
Average
10.3%
Ukrainians
50.0
/100
|
#174
Average
10.3%
Samoans
45.4
/100
|
#175
Average
10.3%
Potawatomi
42.0
/100
|
#176
Average
10.3%
Immigrants | Czechoslovakia
40.8
/100
|
#177
Average
10.3%
Alsatians
40.5
/100
|
#178
Average
10.3%
Tlingit-Haida
39.7
/100
|
#179
Fair
10.3%
Immigrants | Turkey
39.3
/100
|
#180
Fair
10.3%
Okinawans
39.1
/100
|
#181
Fair
10.3%
Immigrants | Germany
38.1
/100
|
#182
Fair
10.4%
Immigrants | Egypt
37.4
/100
|
#183
Fair
10.4%
Greeks
37.2
/100
|
#184
Fair
10.4%
Syrians
35.6
/100
|
#185
Fair
10.4%
Guamanians/Chamorros
35.4
/100
|
#186
Fair
10.4%