Native/Alaskan vs Paiute Unemployment Among Ages 16 to 19 years
COMPARE
Native/Alaskan
Paiute
Unemployment Among Ages 16 to 19 years
Unemployment Among Ages 16 to 19 years Comparison
Natives/Alaskans
Paiute
21.5%
UNEMPLOYMENT AMONG AGES 16 TO 19 YEARS
0.0/ 100
METRIC RATING
309th/ 347
METRIC RANK
24.4%
UNEMPLOYMENT AMONG AGES 16 TO 19 YEARS
0.0/ 100
METRIC RATING
333rd/ 347
METRIC RANK
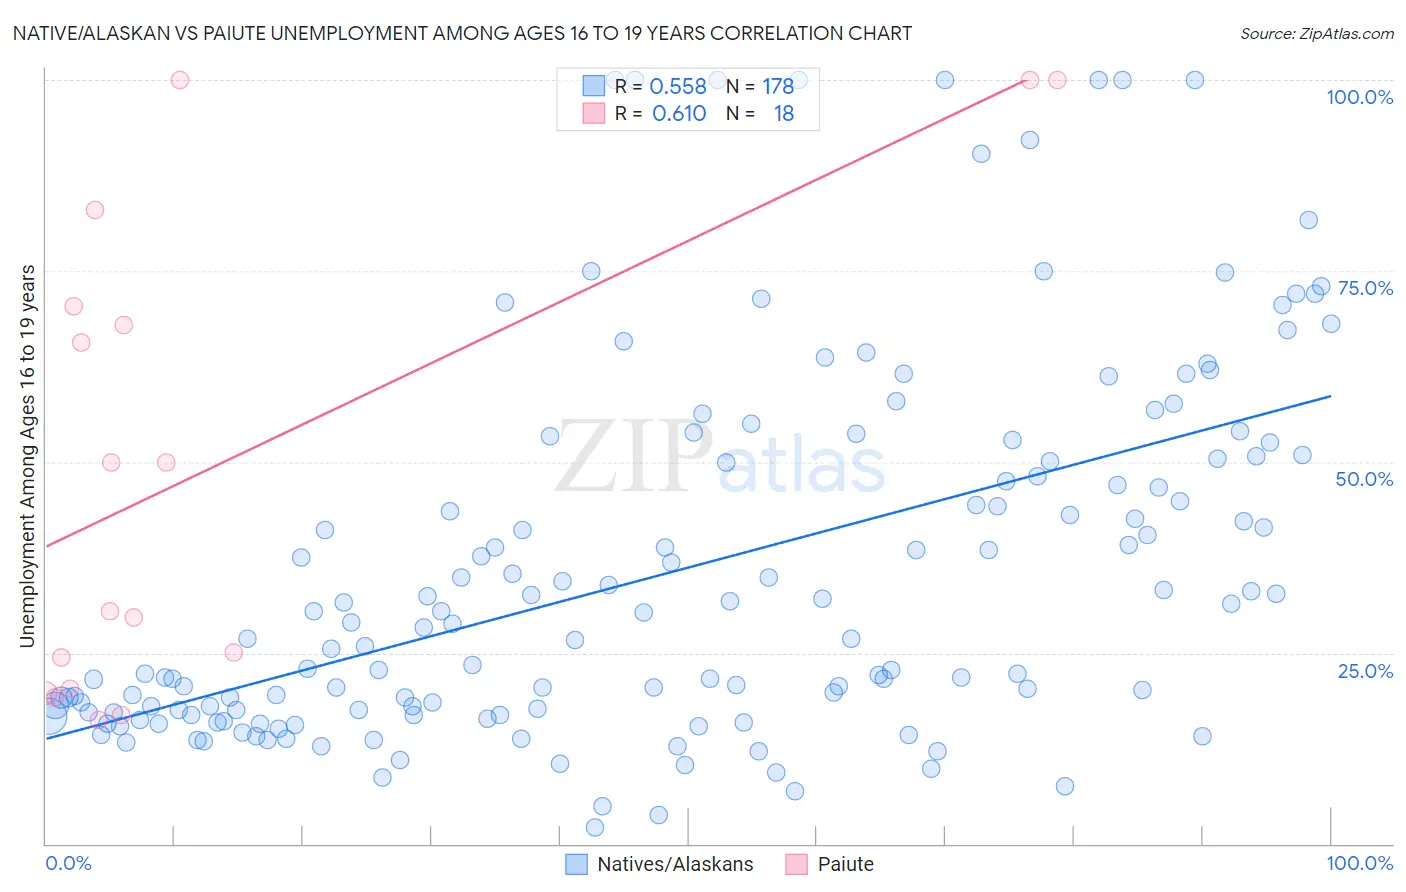
Native/Alaskan vs Paiute Unemployment Among Ages 16 to 19 years Correlation Chart
The statistical analysis conducted on geographies consisting of 472,983,202 people shows a substantial positive correlation between the proportion of Natives/Alaskans and unemployment rate among population between the ages 16 and 19 in the United States with a correlation coefficient (R) of 0.558 and weighted average of 21.5%. Similarly, the statistical analysis conducted on geographies consisting of 57,592,055 people shows a significant positive correlation between the proportion of Paiute and unemployment rate among population between the ages 16 and 19 in the United States with a correlation coefficient (R) of 0.610 and weighted average of 24.4%, a difference of 13.2%.
Unemployment Among Ages 16 to 19 years Correlation Summary
| Measurement | Native/Alaskan | Paiute |
| Minimum | 2.2% | 16.3% |
| Maximum | 100.0% | 100.0% |
| Range | 97.8% | 83.7% |
| Mean | 35.5% | 49.4% |
| Median | 27.6% | 40.2% |
| Interquartile 25% (IQ1) | 17.3% | 20.3% |
| Interquartile 75% (IQ3) | 50.2% | 70.4% |
| Interquartile Range (IQR) | 32.9% | 50.0% |
| Standard Deviation (Sample) | 24.0% | 31.3% |
| Standard Deviation (Population) | 23.9% | 30.4% |
Similar Demographics by Unemployment Among Ages 16 to 19 years
Demographics Similar to Natives/Alaskans by Unemployment Among Ages 16 to 19 years
In terms of unemployment among ages 16 to 19 years, the demographic groups most similar to Natives/Alaskans are Vietnamese (21.5%, a difference of 0.060%), Immigrants from Bangladesh (21.5%, a difference of 0.16%), Belizean (21.6%, a difference of 0.28%), Black/African American (21.4%, a difference of 0.54%), and Houma (21.6%, a difference of 0.54%).
| Demographics | Rating | Rank | Unemployment Among Ages 16 to 19 years |
| Immigrants | Caribbean | 0.0 /100 | #302 | Tragic 20.9% |
| Senegalese | 0.0 /100 | #303 | Tragic 21.0% |
| Aleuts | 0.0 /100 | #304 | Tragic 21.2% |
| Immigrants | Senegal | 0.0 /100 | #305 | Tragic 21.2% |
| U.S. Virgin Islanders | 0.0 /100 | #306 | Tragic 21.3% |
| Blacks/African Americans | 0.0 /100 | #307 | Tragic 21.4% |
| Immigrants | Bangladesh | 0.0 /100 | #308 | Tragic 21.5% |
| Natives/Alaskans | 0.0 /100 | #309 | Tragic 21.5% |
| Vietnamese | 0.0 /100 | #310 | Tragic 21.5% |
| Belizeans | 0.0 /100 | #311 | Tragic 21.6% |
| Houma | 0.0 /100 | #312 | Tragic 21.6% |
| Jamaicans | 0.0 /100 | #313 | Tragic 21.7% |
| Alaska Natives | 0.0 /100 | #314 | Tragic 21.8% |
| Immigrants | Dominica | 0.0 /100 | #315 | Tragic 21.9% |
| Tohono O'odham | 0.0 /100 | #316 | Tragic 22.1% |
Demographics Similar to Paiute by Unemployment Among Ages 16 to 19 years
In terms of unemployment among ages 16 to 19 years, the demographic groups most similar to Paiute are Immigrants from Barbados (24.0%, a difference of 1.4%), British West Indian (24.0%, a difference of 1.6%), Guyanese (24.8%, a difference of 1.9%), Dominican (23.6%, a difference of 3.0%), and Arapaho (25.2%, a difference of 3.3%).
| Demographics | Rating | Rank | Unemployment Among Ages 16 to 19 years |
| Immigrants | Trinidad and Tobago | 0.0 /100 | #326 | Tragic 23.1% |
| Pima | 0.0 /100 | #327 | Tragic 23.1% |
| Immigrants | Dominican Republic | 0.0 /100 | #328 | Tragic 23.3% |
| Tlingit-Haida | 0.0 /100 | #329 | Tragic 23.5% |
| Dominicans | 0.0 /100 | #330 | Tragic 23.6% |
| British West Indians | 0.0 /100 | #331 | Tragic 24.0% |
| Immigrants | Barbados | 0.0 /100 | #332 | Tragic 24.0% |
| Paiute | 0.0 /100 | #333 | Tragic 24.4% |
| Guyanese | 0.0 /100 | #334 | Tragic 24.8% |
| Arapaho | 0.0 /100 | #335 | Tragic 25.2% |
| Kiowa | 0.0 /100 | #336 | Tragic 25.2% |
| Immigrants | Guyana | 0.0 /100 | #337 | Tragic 25.5% |
| Immigrants | St. Vincent and the Grenadines | 0.0 /100 | #338 | Tragic 25.7% |
| Immigrants | Grenada | 0.0 /100 | #339 | Tragic 25.7% |
| Crow | 0.0 /100 | #340 | Tragic 26.2% |