Native/Alaskan vs Immigrants from Armenia Unemployment Among Ages 45 to 54 years
COMPARE
Native/Alaskan
Immigrants from Armenia
Unemployment Among Ages 45 to 54 years
Unemployment Among Ages 45 to 54 years Comparison
Natives/Alaskans
Immigrants from Armenia
6.1%
UNEMPLOYMENT AMONG AGES 45 TO 54 YEARS
0.0/ 100
METRIC RATING
324th/ 347
METRIC RANK
6.1%
UNEMPLOYMENT AMONG AGES 45 TO 54 YEARS
0.0/ 100
METRIC RATING
325th/ 347
METRIC RANK
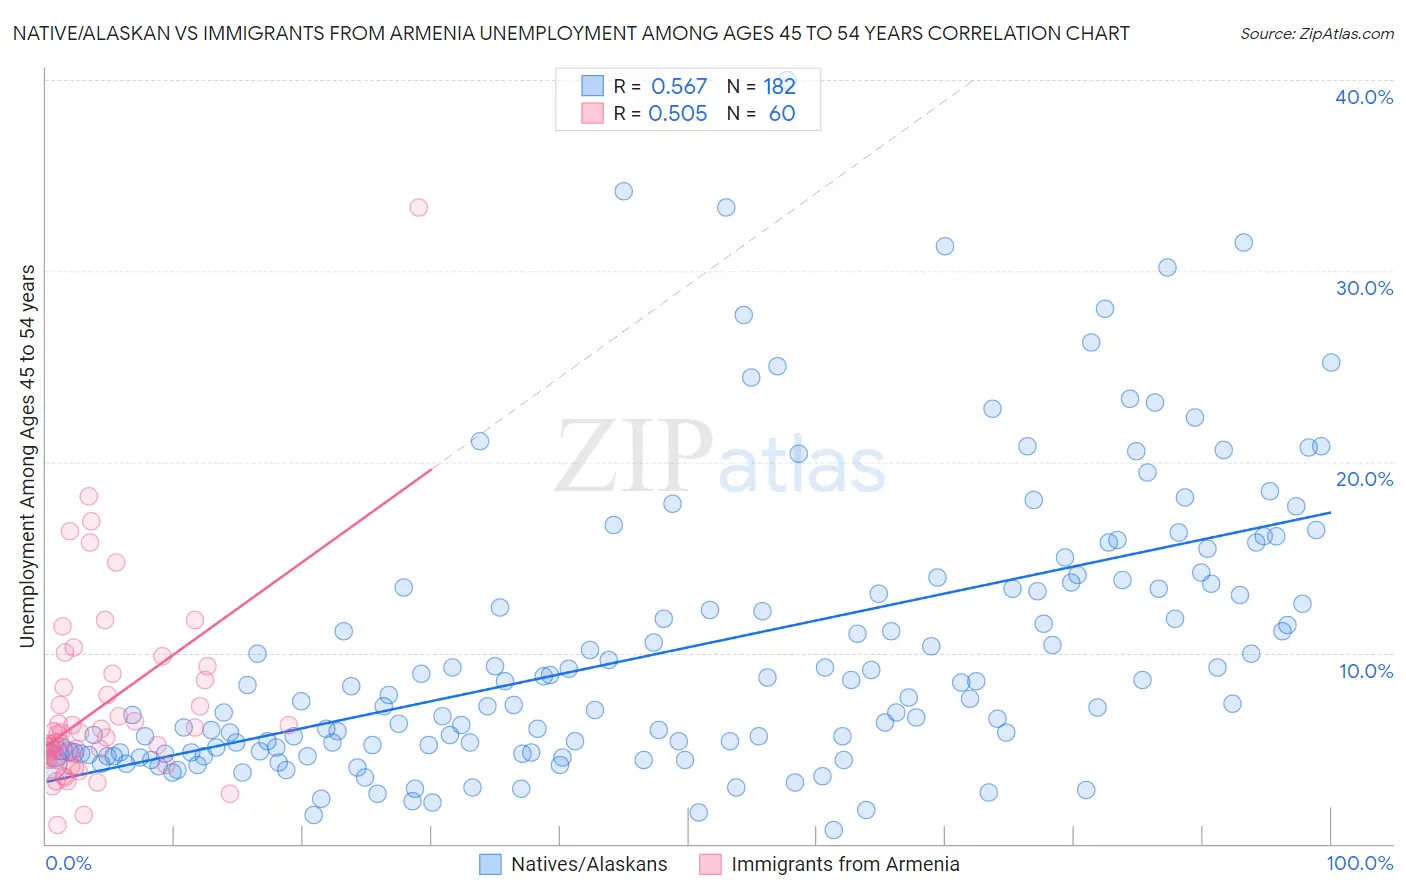
Native/Alaskan vs Immigrants from Armenia Unemployment Among Ages 45 to 54 years Correlation Chart
The statistical analysis conducted on geographies consisting of 487,520,360 people shows a substantial positive correlation between the proportion of Natives/Alaskans and unemployment rate among population between the ages 45 and 54 in the United States with a correlation coefficient (R) of 0.567 and weighted average of 6.1%. Similarly, the statistical analysis conducted on geographies consisting of 97,342,787 people shows a substantial positive correlation between the proportion of Immigrants from Armenia and unemployment rate among population between the ages 45 and 54 in the United States with a correlation coefficient (R) of 0.505 and weighted average of 6.1%, a difference of 1.3%.
Unemployment Among Ages 45 to 54 years Correlation Summary
| Measurement | Native/Alaskan | Immigrants from Armenia |
| Minimum | 0.71% | 1.0% |
| Maximum | 40.0% | 33.3% |
| Range | 39.3% | 32.3% |
| Mean | 10.2% | 7.2% |
| Median | 7.4% | 5.6% |
| Interquartile 25% (IQ1) | 4.8% | 4.4% |
| Interquartile 75% (IQ3) | 13.4% | 8.4% |
| Interquartile Range (IQR) | 8.7% | 4.0% |
| Standard Deviation (Sample) | 7.5% | 5.1% |
| Standard Deviation (Population) | 7.4% | 5.1% |
Demographics Similar to Natives/Alaskans and Immigrants from Armenia by Unemployment Among Ages 45 to 54 years
In terms of unemployment among ages 45 to 54 years, the demographic groups most similar to Natives/Alaskans are Ute (6.2%, a difference of 2.2%), Immigrants from Cabo Verde (5.9%, a difference of 2.3%), Dominican (6.2%, a difference of 2.4%), Pueblo (6.2%, a difference of 2.6%), and Alaska Native (6.3%, a difference of 3.3%). Similarly, the demographic groups most similar to Immigrants from Armenia are Ute (6.2%, a difference of 0.84%), Dominican (6.2%, a difference of 1.1%), Pueblo (6.2%, a difference of 1.3%), Alaska Native (6.3%, a difference of 2.0%), and Immigrants from Dominican Republic (6.3%, a difference of 2.1%).
| Demographics | Rating | Rank | Unemployment Among Ages 45 to 54 years |
| Guyanese | 0.0 /100 | #314 | Tragic 5.6% |
| Immigrants | Dominica | 0.0 /100 | #315 | Tragic 5.6% |
| Immigrants | Guyana | 0.0 /100 | #316 | Tragic 5.6% |
| Houma | 0.0 /100 | #317 | Tragic 5.6% |
| British West Indians | 0.0 /100 | #318 | Tragic 5.7% |
| Cape Verdeans | 0.0 /100 | #319 | Tragic 5.7% |
| Immigrants | St. Vincent and the Grenadines | 0.0 /100 | #320 | Tragic 5.7% |
| Yakama | 0.0 /100 | #321 | Tragic 5.7% |
| Immigrants | Azores | 0.0 /100 | #322 | Tragic 5.7% |
| Immigrants | Cabo Verde | 0.0 /100 | #323 | Tragic 5.9% |
| Natives/Alaskans | 0.0 /100 | #324 | Tragic 6.1% |
| Immigrants | Armenia | 0.0 /100 | #325 | Tragic 6.1% |
| Ute | 0.0 /100 | #326 | Tragic 6.2% |
| Dominicans | 0.0 /100 | #327 | Tragic 6.2% |
| Pueblo | 0.0 /100 | #328 | Tragic 6.2% |
| Alaska Natives | 0.0 /100 | #329 | Tragic 6.3% |
| Immigrants | Dominican Republic | 0.0 /100 | #330 | Tragic 6.3% |
| Tohono O'odham | 0.0 /100 | #331 | Tragic 6.3% |
| Pima | 0.0 /100 | #332 | Tragic 6.4% |
| Immigrants | Yemen | 0.0 /100 | #333 | Tragic 6.5% |
| Sioux | 0.0 /100 | #334 | Tragic 6.6% |