Native Hawaiian vs Lithuanian Unemployment Among Ages 60 to 64 years

COMPARE

Native Hawaiian
Race
Ancestry
AfghanAfricanAlaska NativeAlaskan AthabascanAlbanianAleutAlsatianAmericanApacheArabArapahoArgentineanArmenianAssyrian/Chaldean/SyriacAustralianAustrianBahamianBangladeshiBarbadianBasqueBelgianBelizeanBermudanBhutaneseBlackfeetBolivianBrazilianBritishBritish West IndianBulgarianBurmeseCajunCambodianCanadianCape VerdeanCarpatho RusynCelticCentral AmericanCentral American IndianCherokeeCheyenneChickasawChileanChineseChippewaChoctawColombianColvilleComancheCosta RicanCreeCreekCroatianCrowCubanCypriotCzechCzechoslovakianDanishDelawareDominicanDutchDutch West IndianEastern EuropeanEcuadorianEgyptianEnglishEstonianEthiopianEuropeanFijianFilipinoFinnishFrenchFrench American IndianFrench CanadianGermanGerman RussianGhanaianGreekGuamanian/ChamorroGuatemalanGuyaneseHaitianHmongHonduranHopiHoumaHungarianIcelanderIndian (Asian)IndonesianInupiatIranianIraqiIrishIroquoisIsraeliItalianJamaicanJapaneseJordanianKenyanKiowaKoreanLaotianLatvianLebaneseLiberianLumbeeLuxembourgerMacedonianMalaysianMalteseMarshalleseMenomineeMexicanMexican American IndianMongolianMoroccanNative HawaiianNavajoNepaleseNew ZealanderNicaraguanNigerianNorthern EuropeanNorwegianOkinawanOsageOttawaPaiutePakistaniPalestinianPanamanianParaguayanPennsylvania GermanPeruvianPimaPolishPortuguesePotawatomiPuebloPuerto RicanPuget Sound SalishRomanianRussianSalvadoranSamoanScandinavianScotch-IrishScottishSeminoleSenegaleseSerbianShoshoneSierra LeoneanSiouxSlavicSlovakSloveneSomaliSouth AfricanSouth AmericanSouth American IndianSoviet UnionSpaniardSpanishSpanish AmericanSpanish American IndianSri LankanSubsaharan AfricanSudaneseSwedishSwissSyrianTaiwaneseThaiTlingit-HaidaTohono O'OdhamTonganTrinidadian and TobagonianTsimshianTurkishU.S. Virgin IslanderUgandanUkrainianUruguayanUteVenezuelanVietnameseWelshWest IndianYakamaYaquiYugoslavianYumanYup'ikZimbabwean
Immigration
NonimmigrantsImmigrantsAfghanistanAfricaAlbaniaArgentinaArmeniaAsiaAustraliaAustriaBahamasBangladeshBarbadosBelarusBelgiumBelizeBoliviaBosnia and HerzegovinaBrazilBulgariaBurma/MyanmarCabo VerdeCambodiaCameroonCanadaCaribbeanCentral AmericaChileChinaColombiaCongoCosta RicaCroatiaCubaCzechoslovakiaDenmarkDominicaDominican RepublicEastern AfricaEastern AsiaEastern EuropeEcuadorEgyptEl SalvadorEnglandEritreaEthiopiaEuropeFijiFranceGermanyGhanaGreeceGrenadaGuatemalaGuyanaHaitiHondurasHong KongHungaryIndiaIndonesiaIranIraqIrelandIsraelItalyJamaicaJapanJordanKazakhstanKenyaKoreaKuwaitLaosLatin AmericaLatviaLebanonLiberiaLithuaniaMalaysiaMexicoMicronesiaMiddle AfricaMoldovaMoroccoNepalNetherlandsNicaraguaNigeriaNorth AmericaNorth MacedoniaNorthern AfricaNorthern EuropeNorwayOceaniaPakistanPanamaPeruPhilippinesPolandPortugalRomaniaRussiaSaudi ArabiaScotlandSenegalSerbiaSierra LeoneSingaporeSomaliaSouth AfricaSouth AmericaSouth Central AsiaSouth Eastern AsiaSouthern EuropeSpainSri LankaSt. Vincent and the GrenadinesSudanSwedenSwitzerlandSyriaTaiwanThailandTrinidad and TobagoTurkeyUgandaUkraineUruguayUzbekistanVenezuelaVietnamWest IndiesWestern AfricaWestern AsiaWestern EuropeYemenZaireZimbabweAzores
Lithuanian
Race
Ancestry
AfghanAfricanAlaska NativeAlaskan AthabascanAlbanianAleutAlsatianAmericanApacheArabArapahoArgentineanArmenianAssyrian/Chaldean/SyriacAustralianAustrianBahamianBangladeshiBarbadianBasqueBelgianBelizeanBermudanBhutaneseBlackfeetBolivianBrazilianBritishBritish West IndianBulgarianBurmeseCajunCambodianCanadianCape VerdeanCarpatho RusynCelticCentral AmericanCentral American IndianCherokeeCheyenneChickasawChileanChineseChippewaChoctawColombianColvilleComancheCosta RicanCreeCreekCroatianCrowCubanCypriotCzechCzechoslovakianDanishDelawareDominicanDutchDutch West IndianEastern EuropeanEcuadorianEgyptianEnglishEstonianEthiopianEuropeanFijianFilipinoFinnishFrenchFrench American IndianFrench CanadianGermanGerman RussianGhanaianGreekGuamanian/ChamorroGuatemalanGuyaneseHaitianHmongHonduranHopiHoumaHungarianIcelanderIndian (Asian)IndonesianInupiatIranianIraqiIrishIroquoisIsraeliItalianJamaicanJapaneseJordanianKenyanKiowaKoreanLaotianLatvianLebaneseLiberianLithuanianLumbeeLuxembourgerMacedonianMalaysianMalteseMarshalleseMenomineeMexicanMexican American IndianMongolianMoroccanNavajoNepaleseNew ZealanderNicaraguanNigerianNorthern EuropeanNorwegianOkinawanOsageOttawaPaiutePakistaniPalestinianPanamanianParaguayanPennsylvania GermanPeruvianPimaPolishPortuguesePotawatomiPuebloPuerto RicanPuget Sound SalishRomanianRussianSalvadoranSamoanScandinavianScotch-IrishScottishSeminoleSenegaleseSerbianShoshoneSierra LeoneanSiouxSlavicSlovakSloveneSomaliSouth AfricanSouth AmericanSouth American IndianSoviet UnionSpaniardSpanishSpanish AmericanSpanish American IndianSri LankanSubsaharan AfricanSudaneseSwedishSwissSyrianTaiwaneseThaiTlingit-HaidaTohono O'OdhamTonganTrinidadian and TobagonianTsimshianTurkishU.S. Virgin IslanderUgandanUkrainianUruguayanUteVenezuelanVietnameseWelshWest IndianYakamaYaquiYugoslavianYumanYup'ikZimbabwean
Immigration
NonimmigrantsImmigrantsAfghanistanAfricaAlbaniaArgentinaArmeniaAsiaAustraliaAustriaBahamasBangladeshBarbadosBelarusBelgiumBelizeBoliviaBosnia and HerzegovinaBrazilBulgariaBurma/MyanmarCabo VerdeCambodiaCameroonCanadaCaribbeanCentral AmericaChileChinaColombiaCongoCosta RicaCroatiaCubaCzechoslovakiaDenmarkDominicaDominican RepublicEastern AfricaEastern AsiaEastern EuropeEcuadorEgyptEl SalvadorEnglandEritreaEthiopiaEuropeFijiFranceGermanyGhanaGreeceGrenadaGuatemalaGuyanaHaitiHondurasHong KongHungaryIndiaIndonesiaIranIraqIrelandIsraelItalyJamaicaJapanJordanKazakhstanKenyaKoreaKuwaitLaosLatin AmericaLatviaLebanonLiberiaLithuaniaMalaysiaMexicoMicronesiaMiddle AfricaMoldovaMoroccoNepalNetherlandsNicaraguaNigeriaNorth AmericaNorth MacedoniaNorthern AfricaNorthern EuropeNorwayOceaniaPakistanPanamaPeruPhilippinesPolandPortugalRomaniaRussiaSaudi ArabiaScotlandSenegalSerbiaSierra LeoneSingaporeSomaliaSouth AfricaSouth AmericaSouth Central AsiaSouth Eastern AsiaSouthern EuropeSpainSri LankaSt. Vincent and the GrenadinesSudanSwedenSwitzerlandSyriaTaiwanThailandTrinidad and TobagoTurkeyUgandaUkraineUruguayUzbekistanVenezuelaVietnamWest IndiesWestern AfricaWestern AsiaWestern EuropeYemenZaireZimbabweAzores
Unemployment Among Ages 60 to 64 years
Income
Poverty
Unemployment
Labor Participation
Family Structure
Vehicle Availability
Education Level
Disability

Unemployment Among Ages 60 to 64 years Comparison

Native Hawaiians

Lithuanians

Exceptional
Excellent
4.5%
UNEMPLOYMENT AMONG AGES 60 TO 64 YEARS
100.0/ 100
METRIC RATING
38th/ 347
METRIC RANK
4.8%
UNEMPLOYMENT AMONG AGES 60 TO 64 YEARS
89.6/ 100
METRIC RATING
132nd/ 347
METRIC RANK

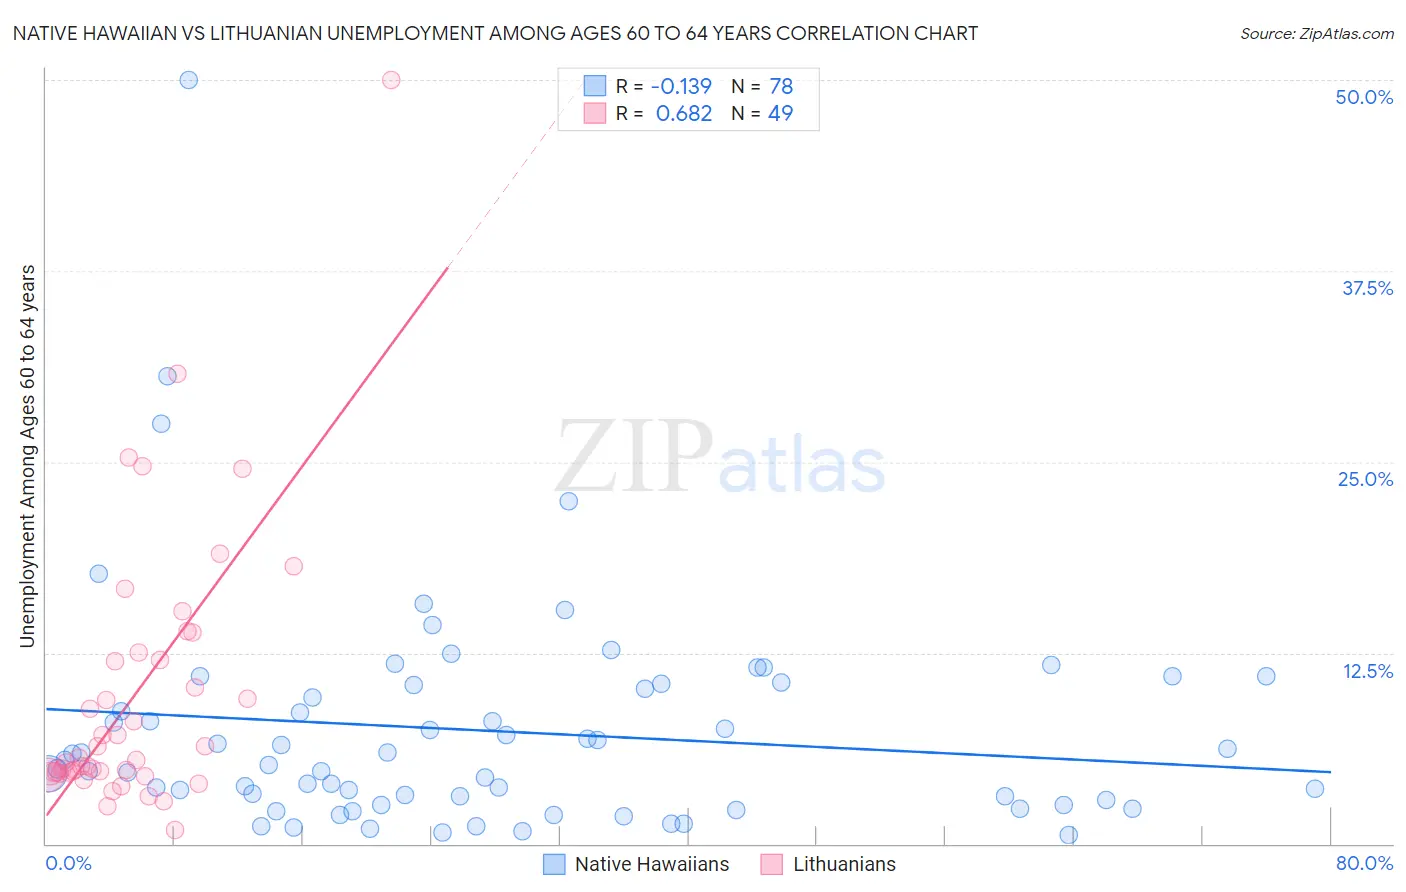
Native Hawaiian vs Lithuanian Unemployment Among Ages 60 to 64 years Correlation Chart

The statistical analysis conducted on geographies consisting of 302,694,280 people shows a poor negative correlation between the proportion of Native Hawaiians and unemployment rate among population between the ages 60 and 64 in the United States with a correlation coefficient (R) of -0.139 and weighted average of 4.5%. Similarly, the statistical analysis conducted on geographies consisting of 375,803,898 people shows a significant positive correlation between the proportion of Lithuanians and unemployment rate among population between the ages 60 and 64 in the United States with a correlation coefficient (R) of 0.682 and weighted average of 4.8%, a difference of 5.9%.
Native Hawaiian vs Lithuanian Unemployment Among Ages 60 to 64 years

Unemployment Among Ages 60 to 64 years Correlation Summary

MeasurementNative HawaiianLithuanian
Minimum0.60%0.90%
Maximum50.0%50.0%
Range49.4%49.1%
Mean7.4%9.7%
Median5.3%5.5%
Interquartile 25% (IQ1)2.9%4.6%
Interquartile 75% (IQ3)10.4%12.2%
Interquartile Range (IQR)7.5%7.6%
Standard Deviation (Sample)7.5%9.0%
Standard Deviation (Population)7.5%8.9%

Similar Demographics by Unemployment Among Ages 60 to 64 years

Demographics Similar to Native Hawaiians by Unemployment Among Ages 60 to 64 years

In terms of unemployment among ages 60 to 64 years, the demographic groups most similar to Native Hawaiians are Iraqi (4.5%, a difference of 0.0%), Scandinavian (4.5%, a difference of 0.15%), Immigrants from Portugal (4.5%, a difference of 0.20%), Venezuelan (4.5%, a difference of 0.23%), and German (4.5%, a difference of 0.24%).
DemographicsRating | RankUnemployment Among Ages 60 to 64 years
Immigrants | Eritrea
100.0
/100
|
#31
Exceptional
4.5%
Zimbabweans
100.0
/100
|
#32
Exceptional
4.5%
Carpatho Rusyns
100.0
/100
|
#33
Exceptional
4.5%
Belgians
100.0
/100
|
#34
Exceptional
4.5%
Germans
100.0
/100
|
#35
Exceptional
4.5%
Venezuelans
100.0
/100
|
#36
Exceptional
4.5%
Immigrants | Portugal
100.0
/100
|
#37
Exceptional
4.5%
Native Hawaiians
100.0
/100
|
#38
Exceptional
4.5%
Iraqis
100.0
/100
|
#39
Exceptional
4.5%
Scandinavians
100.0
/100
|
#40
Exceptional
4.5%
Immigrants | Sudan
100.0
/100
|
#41
Exceptional
4.5%
English
100.0
/100
|
#42
Exceptional
4.5%
Swedes
100.0
/100
|
#43
Exceptional
4.5%
Europeans
100.0
/100
|
#44
Exceptional
4.5%
Liberians
99.9
/100
|
#45
Exceptional
4.5%

Demographics Similar to Lithuanians by Unemployment Among Ages 60 to 64 years

In terms of unemployment among ages 60 to 64 years, the demographic groups most similar to Lithuanians are Immigrants from Lebanon (4.8%, a difference of 0.0%), Yaqui (4.8%, a difference of 0.010%), Immigrants from Syria (4.8%, a difference of 0.060%), Choctaw (4.8%, a difference of 0.070%), and Immigrants from Serbia (4.8%, a difference of 0.070%).
DemographicsRating | RankUnemployment Among Ages 60 to 64 years
Immigrants | Thailand
93.7
/100
|
#125
Exceptional
4.7%
Immigrants | South Central Asia
93.0
/100
|
#126
Exceptional
4.7%
Austrians
91.9
/100
|
#127
Exceptional
4.8%
Choctaw
90.3
/100
|
#128
Exceptional
4.8%
Immigrants | Serbia
90.2
/100
|
#129
Exceptional
4.8%
Immigrants | Syria
90.1
/100
|
#130
Exceptional
4.8%
Immigrants | Lebanon
89.6
/100
|
#131
Excellent
4.8%
Lithuanians
89.6
/100
|
#132
Excellent
4.8%
Yaqui
89.5
/100
|
#133
Excellent
4.8%
Basques
88.8
/100
|
#134
Excellent
4.8%
Pennsylvania Germans
87.8
/100
|
#135
Excellent
4.8%
French Canadians
87.6
/100
|
#136
Excellent
4.8%
Cambodians
86.9
/100
|
#137
Excellent
4.8%
Immigrants | Lithuania
86.7
/100
|
#138
Excellent
4.8%
Immigrants | Africa
86.6
/100
|
#139
Excellent
4.8%