Moroccan vs Immigrants from South Africa Unemployment Among Seniors over 75 years
COMPARE
Moroccan
Immigrants from South Africa
Unemployment Among Seniors over 75 years
Unemployment Among Seniors over 75 years Comparison
Moroccans
Immigrants from South Africa
7.8%
UNEMPLOYMENT AMONG SENIORS OVER 75 YEARS
100.0/ 100
METRIC RATING
51st/ 347
METRIC RANK
8.0%
UNEMPLOYMENT AMONG SENIORS OVER 75 YEARS
99.9/ 100
METRIC RATING
68th/ 347
METRIC RANK
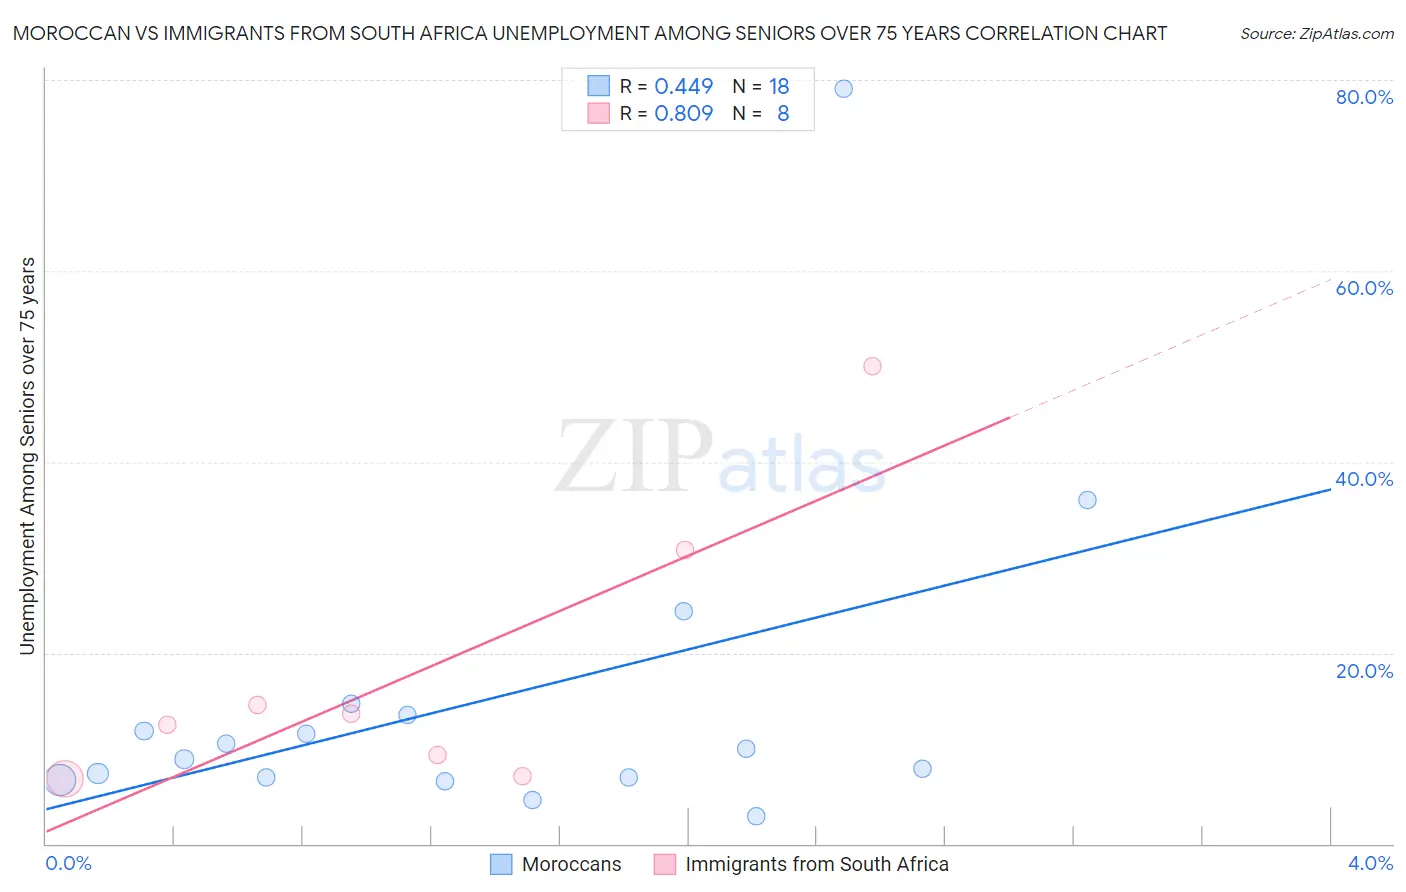
Moroccan vs Immigrants from South Africa Unemployment Among Seniors over 75 years Correlation Chart
The statistical analysis conducted on geographies consisting of 131,616,504 people shows a moderate positive correlation between the proportion of Moroccans and unemployment rate among seniors over the age of 75 in the United States with a correlation coefficient (R) of 0.449 and weighted average of 7.8%. Similarly, the statistical analysis conducted on geographies consisting of 144,222,383 people shows a very strong positive correlation between the proportion of Immigrants from South Africa and unemployment rate among seniors over the age of 75 in the United States with a correlation coefficient (R) of 0.809 and weighted average of 8.0%, a difference of 1.7%.
Unemployment Among Seniors over 75 years Correlation Summary
| Measurement | Moroccan | Immigrants from South Africa |
| Minimum | 2.9% | 6.8% |
| Maximum | 79.1% | 50.0% |
| Range | 76.2% | 43.2% |
| Mean | 15.0% | 18.1% |
| Median | 9.4% | 13.0% |
| Interquartile 25% (IQ1) | 6.9% | 8.2% |
| Interquartile 75% (IQ3) | 13.4% | 22.7% |
| Interquartile Range (IQR) | 6.5% | 14.5% |
| Standard Deviation (Sample) | 17.8% | 15.0% |
| Standard Deviation (Population) | 17.3% | 14.0% |
Demographics Similar to Moroccans and Immigrants from South Africa by Unemployment Among Seniors over 75 years
In terms of unemployment among seniors over 75 years, the demographic groups most similar to Moroccans are Immigrants from Latvia (7.8%, a difference of 0.050%), Potawatomi (7.8%, a difference of 0.080%), Bahamian (7.8%, a difference of 0.24%), Immigrants from Egypt (7.9%, a difference of 0.31%), and Immigrants from Malaysia (7.9%, a difference of 0.35%). Similarly, the demographic groups most similar to Immigrants from South Africa are Indian (Asian) (8.0%, a difference of 0.010%), Immigrants from Syria (8.0%, a difference of 0.090%), Immigrants from Austria (8.0%, a difference of 0.13%), Argentinean (7.9%, a difference of 0.32%), and Immigrants from Taiwan (7.9%, a difference of 0.38%).
| Demographics | Rating | Rank | Unemployment Among Seniors over 75 years |
| Potawatomi | 100.0 /100 | #49 | Exceptional 7.8% |
| Immigrants | Latvia | 100.0 /100 | #50 | Exceptional 7.8% |
| Moroccans | 100.0 /100 | #51 | Exceptional 7.8% |
| Bahamians | 100.0 /100 | #52 | Exceptional 7.8% |
| Immigrants | Egypt | 100.0 /100 | #53 | Exceptional 7.9% |
| Immigrants | Malaysia | 99.9 /100 | #54 | Exceptional 7.9% |
| Filipinos | 99.9 /100 | #55 | Exceptional 7.9% |
| Immigrants | Eastern Asia | 99.9 /100 | #56 | Exceptional 7.9% |
| Ottawa | 99.9 /100 | #57 | Exceptional 7.9% |
| Iranians | 99.9 /100 | #58 | Exceptional 7.9% |
| Indonesians | 99.9 /100 | #59 | Exceptional 7.9% |
| Immigrants | Morocco | 99.9 /100 | #60 | Exceptional 7.9% |
| Uruguayans | 99.9 /100 | #61 | Exceptional 7.9% |
| Immigrants | Albania | 99.9 /100 | #62 | Exceptional 7.9% |
| Immigrants | Nicaragua | 99.9 /100 | #63 | Exceptional 7.9% |
| Immigrants | Taiwan | 99.9 /100 | #64 | Exceptional 7.9% |
| Argentineans | 99.9 /100 | #65 | Exceptional 7.9% |
| Immigrants | Austria | 99.9 /100 | #66 | Exceptional 8.0% |
| Immigrants | Syria | 99.9 /100 | #67 | Exceptional 8.0% |
| Immigrants | South Africa | 99.9 /100 | #68 | Exceptional 8.0% |
| Indians (Asian) | 99.9 /100 | #69 | Exceptional 8.0% |