Mexican vs South African Unemployment Among Ages 55 to 59 years
COMPARE
Mexican
South African
Unemployment Among Ages 55 to 59 years
Unemployment Among Ages 55 to 59 years Comparison
Mexicans
South Africans
5.2%
UNEMPLOYMENT AMONG AGES 55 TO 59 YEARS
0.1/ 100
METRIC RATING
268th/ 347
METRIC RANK
4.7%
UNEMPLOYMENT AMONG AGES 55 TO 59 YEARS
95.6/ 100
METRIC RATING
95th/ 347
METRIC RANK
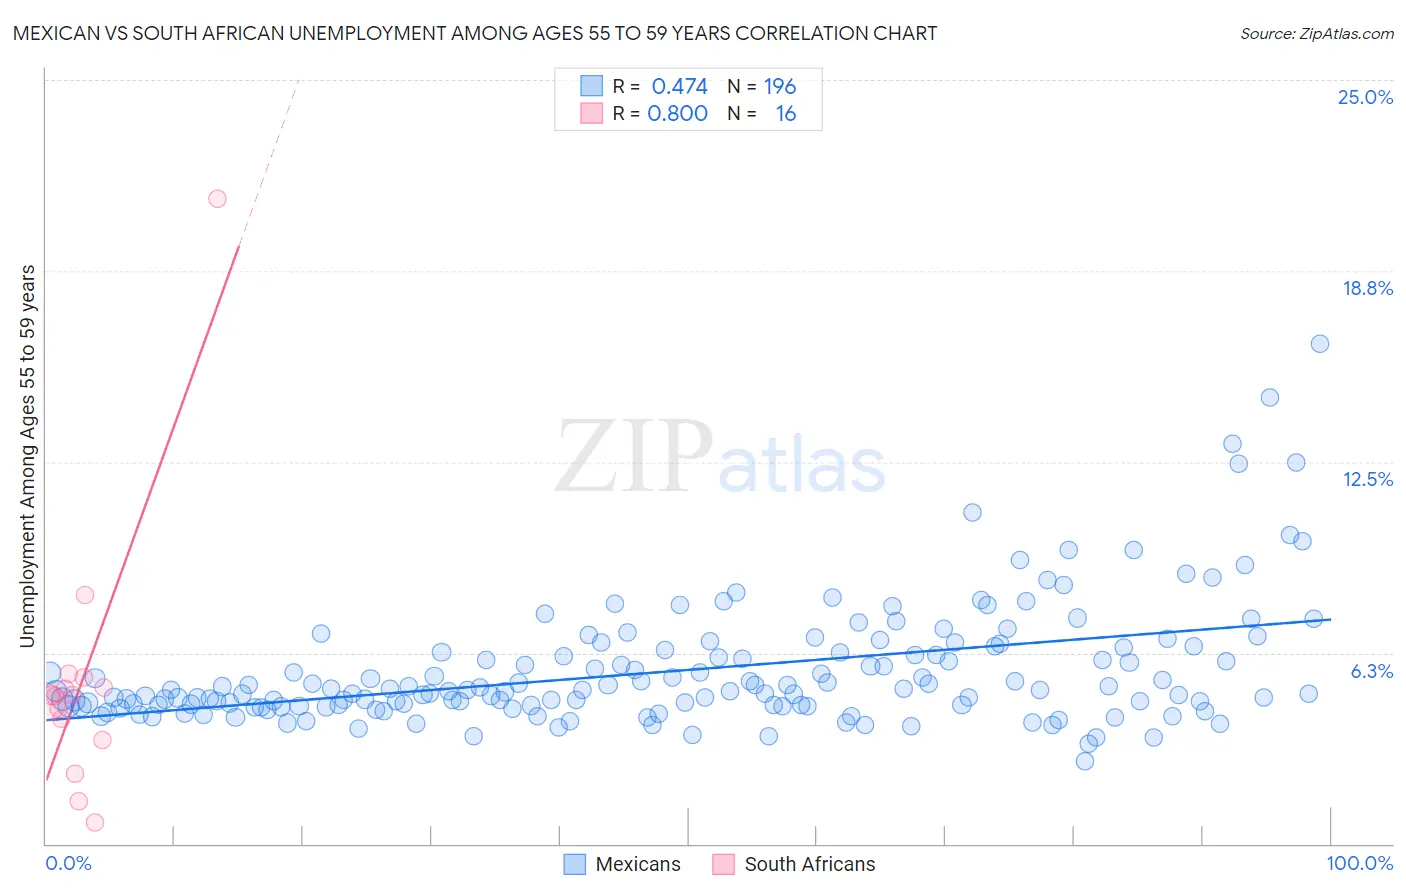
Mexican vs South African Unemployment Among Ages 55 to 59 years Correlation Chart
The statistical analysis conducted on geographies consisting of 485,380,600 people shows a moderate positive correlation between the proportion of Mexicans and unemployment rate among population between the ages 55 and 59 in the United States with a correlation coefficient (R) of 0.474 and weighted average of 5.2%. Similarly, the statistical analysis conducted on geographies consisting of 175,713,158 people shows a very strong positive correlation between the proportion of South Africans and unemployment rate among population between the ages 55 and 59 in the United States with a correlation coefficient (R) of 0.800 and weighted average of 4.7%, a difference of 10.6%.
Unemployment Among Ages 55 to 59 years Correlation Summary
| Measurement | Mexican | South African |
| Minimum | 2.7% | 0.70% |
| Maximum | 16.4% | 21.1% |
| Range | 13.7% | 20.4% |
| Mean | 5.7% | 5.4% |
| Median | 5.0% | 4.8% |
| Interquartile 25% (IQ1) | 4.5% | 3.7% |
| Interquartile 75% (IQ3) | 6.3% | 5.3% |
| Interquartile Range (IQR) | 1.7% | 1.5% |
| Standard Deviation (Sample) | 2.0% | 4.5% |
| Standard Deviation (Population) | 2.0% | 4.4% |
Similar Demographics by Unemployment Among Ages 55 to 59 years
Demographics Similar to Mexicans by Unemployment Among Ages 55 to 59 years
In terms of unemployment among ages 55 to 59 years, the demographic groups most similar to Mexicans are Jamaican (5.2%, a difference of 0.010%), Immigrants from Senegal (5.2%, a difference of 0.010%), Tsimshian (5.2%, a difference of 0.020%), Yaqui (5.2%, a difference of 0.040%), and Immigrants from Caribbean (5.2%, a difference of 0.10%).
| Demographics | Rating | Rank | Unemployment Among Ages 55 to 59 years |
| Africans | 0.1 /100 | #261 | Tragic 5.1% |
| Immigrants | El Salvador | 0.1 /100 | #262 | Tragic 5.1% |
| Immigrants | Sierra Leone | 0.1 /100 | #263 | Tragic 5.2% |
| Immigrants | Caribbean | 0.1 /100 | #264 | Tragic 5.2% |
| Yaqui | 0.1 /100 | #265 | Tragic 5.2% |
| Jamaicans | 0.1 /100 | #266 | Tragic 5.2% |
| Immigrants | Senegal | 0.1 /100 | #267 | Tragic 5.2% |
| Mexicans | 0.1 /100 | #268 | Tragic 5.2% |
| Tsimshian | 0.1 /100 | #269 | Tragic 5.2% |
| Ute | 0.1 /100 | #270 | Tragic 5.2% |
| Cree | 0.1 /100 | #271 | Tragic 5.2% |
| Immigrants | Jamaica | 0.0 /100 | #272 | Tragic 5.2% |
| Ottawa | 0.0 /100 | #273 | Tragic 5.2% |
| Mexican American Indians | 0.0 /100 | #274 | Tragic 5.2% |
| Israelis | 0.0 /100 | #275 | Tragic 5.2% |
Demographics Similar to South Africans by Unemployment Among Ages 55 to 59 years
In terms of unemployment among ages 55 to 59 years, the demographic groups most similar to South Africans are Immigrants from Scotland (4.7%, a difference of 0.030%), Immigrants from England (4.7%, a difference of 0.040%), Iraqi (4.7%, a difference of 0.12%), Immigrants from Belgium (4.7%, a difference of 0.16%), and Immigrants from Canada (4.7%, a difference of 0.17%).
| Demographics | Rating | Rank | Unemployment Among Ages 55 to 59 years |
| Immigrants | Cameroon | 96.9 /100 | #88 | Exceptional 4.7% |
| Irish | 96.8 /100 | #89 | Exceptional 4.7% |
| Immigrants | Poland | 96.4 /100 | #90 | Exceptional 4.7% |
| New Zealanders | 96.3 /100 | #91 | Exceptional 4.7% |
| Iraqis | 96.1 /100 | #92 | Exceptional 4.7% |
| Immigrants | England | 95.8 /100 | #93 | Exceptional 4.7% |
| Immigrants | Scotland | 95.7 /100 | #94 | Exceptional 4.7% |
| South Africans | 95.6 /100 | #95 | Exceptional 4.7% |
| Immigrants | Belgium | 95.0 /100 | #96 | Exceptional 4.7% |
| Immigrants | Canada | 94.9 /100 | #97 | Exceptional 4.7% |
| Immigrants | Germany | 94.8 /100 | #98 | Exceptional 4.7% |
| Yugoslavians | 94.7 /100 | #99 | Exceptional 4.7% |
| Serbians | 94.4 /100 | #100 | Exceptional 4.7% |
| Celtics | 94.3 /100 | #101 | Exceptional 4.7% |
| Canadians | 94.1 /100 | #102 | Exceptional 4.7% |