Mexican vs Immigrants from Germany Unemployment Among Women with Children Under 6 years

COMPARE

Mexican
Race
Ancestry
AfghanAfricanAlaska NativeAlaskan AthabascanAlbanianAleutAlsatianAmericanApacheArabArapahoArgentineanArmenianAssyrian/Chaldean/SyriacAustralianAustrianBahamianBangladeshiBarbadianBasqueBelgianBelizeanBermudanBhutaneseBlackfeetBolivianBrazilianBritishBritish West IndianBulgarianBurmeseCajunCambodianCanadianCape VerdeanCarpatho RusynCelticCentral AmericanCentral American IndianCherokeeCheyenneChickasawChileanChineseChippewaChoctawColombianColvilleComancheCosta RicanCreeCreekCroatianCrowCubanCypriotCzechCzechoslovakianDanishDelawareDominicanDutchDutch West IndianEastern EuropeanEcuadorianEgyptianEnglishEstonianEthiopianEuropeanFijianFilipinoFinnishFrenchFrench American IndianFrench CanadianGermanGerman RussianGhanaianGreekGuamanian/ChamorroGuatemalanGuyaneseHaitianHmongHonduranHopiHoumaHungarianIcelanderIndian (Asian)IndonesianInupiatIranianIraqiIrishIroquoisIsraeliItalianJamaicanJapaneseJordanianKenyanKiowaKoreanLaotianLatvianLebaneseLiberianLithuanianLumbeeLuxembourgerMacedonianMalaysianMalteseMarshalleseMenomineeMexicanMexican American IndianMongolianMoroccanNative HawaiianNavajoNepaleseNew ZealanderNicaraguanNigerianNorthern EuropeanNorwegianOkinawanOsageOttawaPaiutePakistaniPalestinianPanamanianParaguayanPennsylvania GermanPeruvianPimaPolishPortuguesePotawatomiPuebloPuerto RicanPuget Sound SalishRomanianRussianSalvadoranSamoanScandinavianScotch-IrishScottishSeminoleSenegaleseSerbianShoshoneSierra LeoneanSiouxSlavicSlovakSloveneSomaliSouth AfricanSouth AmericanSouth American IndianSoviet UnionSpaniardSpanishSpanish AmericanSpanish American IndianSri LankanSubsaharan AfricanSudaneseSwedishSwissSyrianTaiwaneseThaiTlingit-HaidaTohono O'OdhamTonganTrinidadian and TobagonianTsimshianTurkishU.S. Virgin IslanderUgandanUkrainianUruguayanUteVenezuelanVietnameseWelshWest IndianYakamaYaquiYugoslavianYumanYup'ikZimbabwean
Immigration
NonimmigrantsImmigrantsAfghanistanAfricaAlbaniaArgentinaArmeniaAsiaAustraliaAustriaBahamasBangladeshBarbadosBelarusBelgiumBelizeBoliviaBosnia and HerzegovinaBrazilBulgariaBurma/MyanmarCabo VerdeCambodiaCameroonCanadaCaribbeanCentral AmericaChileChinaColombiaCongoCosta RicaCroatiaCubaCzechoslovakiaDenmarkDominicaDominican RepublicEastern AfricaEastern AsiaEastern EuropeEcuadorEgyptEl SalvadorEnglandEritreaEthiopiaEuropeFijiFranceGhanaGreeceGrenadaGuatemalaGuyanaHaitiHondurasHong KongHungaryIndiaIndonesiaIranIraqIrelandIsraelItalyJamaicaJapanJordanKazakhstanKenyaKoreaKuwaitLaosLatin AmericaLatviaLebanonLiberiaLithuaniaMalaysiaMexicoMicronesiaMiddle AfricaMoldovaMoroccoNepalNetherlandsNicaraguaNigeriaNorth AmericaNorth MacedoniaNorthern AfricaNorthern EuropeNorwayOceaniaPakistanPanamaPeruPhilippinesPolandPortugalRomaniaRussiaSaudi ArabiaScotlandSenegalSerbiaSierra LeoneSingaporeSomaliaSouth AfricaSouth AmericaSouth Central AsiaSouth Eastern AsiaSouthern EuropeSpainSri LankaSt. Vincent and the GrenadinesSudanSwedenSwitzerlandSyriaTaiwanThailandTrinidad and TobagoTurkeyUgandaUkraineUruguayUzbekistanVenezuelaVietnamWest IndiesWestern AfricaWestern AsiaWestern EuropeYemenZaireZimbabweAzores
Immigrants from Germany
Race
Ancestry
AfghanAfricanAlaska NativeAlaskan AthabascanAlbanianAleutAlsatianAmericanApacheArabArapahoArgentineanArmenianAssyrian/Chaldean/SyriacAustralianAustrianBahamianBangladeshiBarbadianBasqueBelgianBelizeanBermudanBhutaneseBlackfeetBolivianBrazilianBritishBritish West IndianBulgarianBurmeseCajunCambodianCanadianCape VerdeanCarpatho RusynCelticCentral AmericanCentral American IndianCherokeeCheyenneChickasawChileanChineseChippewaChoctawColombianColvilleComancheCosta RicanCreeCreekCroatianCrowCubanCypriotCzechCzechoslovakianDanishDelawareDominicanDutchDutch West IndianEastern EuropeanEcuadorianEgyptianEnglishEstonianEthiopianEuropeanFijianFilipinoFinnishFrenchFrench American IndianFrench CanadianGermanGerman RussianGhanaianGreekGuamanian/ChamorroGuatemalanGuyaneseHaitianHmongHonduranHopiHoumaHungarianIcelanderIndian (Asian)IndonesianInupiatIranianIraqiIrishIroquoisIsraeliItalianJamaicanJapaneseJordanianKenyanKiowaKoreanLaotianLatvianLebaneseLiberianLithuanianLumbeeLuxembourgerMacedonianMalaysianMalteseMarshalleseMenomineeMexican American IndianMongolianMoroccanNative HawaiianNavajoNepaleseNew ZealanderNicaraguanNigerianNorthern EuropeanNorwegianOkinawanOsageOttawaPaiutePakistaniPalestinianPanamanianParaguayanPennsylvania GermanPeruvianPimaPolishPortuguesePotawatomiPuebloPuerto RicanPuget Sound SalishRomanianRussianSalvadoranSamoanScandinavianScotch-IrishScottishSeminoleSenegaleseSerbianShoshoneSierra LeoneanSiouxSlavicSlovakSloveneSomaliSouth AfricanSouth AmericanSouth American IndianSoviet UnionSpaniardSpanishSpanish AmericanSpanish American IndianSri LankanSubsaharan AfricanSudaneseSwedishSwissSyrianTaiwaneseThaiTlingit-HaidaTohono O'OdhamTonganTrinidadian and TobagonianTsimshianTurkishU.S. Virgin IslanderUgandanUkrainianUruguayanUteVenezuelanVietnameseWelshWest IndianYakamaYaquiYugoslavianYumanYup'ikZimbabwean
Immigration
NonimmigrantsImmigrantsAfghanistanAfricaAlbaniaArgentinaArmeniaAsiaAustraliaAustriaBahamasBangladeshBarbadosBelarusBelgiumBelizeBoliviaBosnia and HerzegovinaBrazilBulgariaBurma/MyanmarCabo VerdeCambodiaCameroonCanadaCaribbeanCentral AmericaChileChinaColombiaCongoCosta RicaCroatiaCubaCzechoslovakiaDenmarkDominicaDominican RepublicEastern AfricaEastern AsiaEastern EuropeEcuadorEgyptEl SalvadorEnglandEritreaEthiopiaEuropeFijiFranceGermanyGhanaGreeceGrenadaGuatemalaGuyanaHaitiHondurasHong KongHungaryIndiaIndonesiaIranIraqIrelandIsraelItalyJamaicaJapanJordanKazakhstanKenyaKoreaKuwaitLaosLatin AmericaLatviaLebanonLiberiaLithuaniaMalaysiaMexicoMicronesiaMiddle AfricaMoldovaMoroccoNepalNetherlandsNicaraguaNigeriaNorth AmericaNorth MacedoniaNorthern AfricaNorthern EuropeNorwayOceaniaPakistanPanamaPeruPhilippinesPolandPortugalRomaniaRussiaSaudi ArabiaScotlandSenegalSerbiaSierra LeoneSingaporeSomaliaSouth AfricaSouth AmericaSouth Central AsiaSouth Eastern AsiaSouthern EuropeSpainSri LankaSt. Vincent and the GrenadinesSudanSwedenSwitzerlandSyriaTaiwanThailandTrinidad and TobagoTurkeyUgandaUkraineUruguayUzbekistanVenezuelaVietnamWest IndiesWestern AfricaWestern AsiaWestern EuropeYemenZaireZimbabweAzores
Unemployment Among Women with Children Under 6 years
Income
Poverty
Unemployment
Labor Participation
Family Structure
Vehicle Availability
Education Level
Disability

Unemployment Among Women with Children Under 6 years Comparison

Mexicans

Immigrants from Germany

Tragic
Tragic
8.9%
UNEMPLOYMENT AMONG WOMEN WITH CHILDREN UNDER 6 YEARS
0.0/ 100
METRIC RATING
297th/ 347
METRIC RANK
7.9%
UNEMPLOYMENT AMONG WOMEN WITH CHILDREN UNDER 6 YEARS
8.5/ 100
METRIC RATING
221st/ 347
METRIC RANK

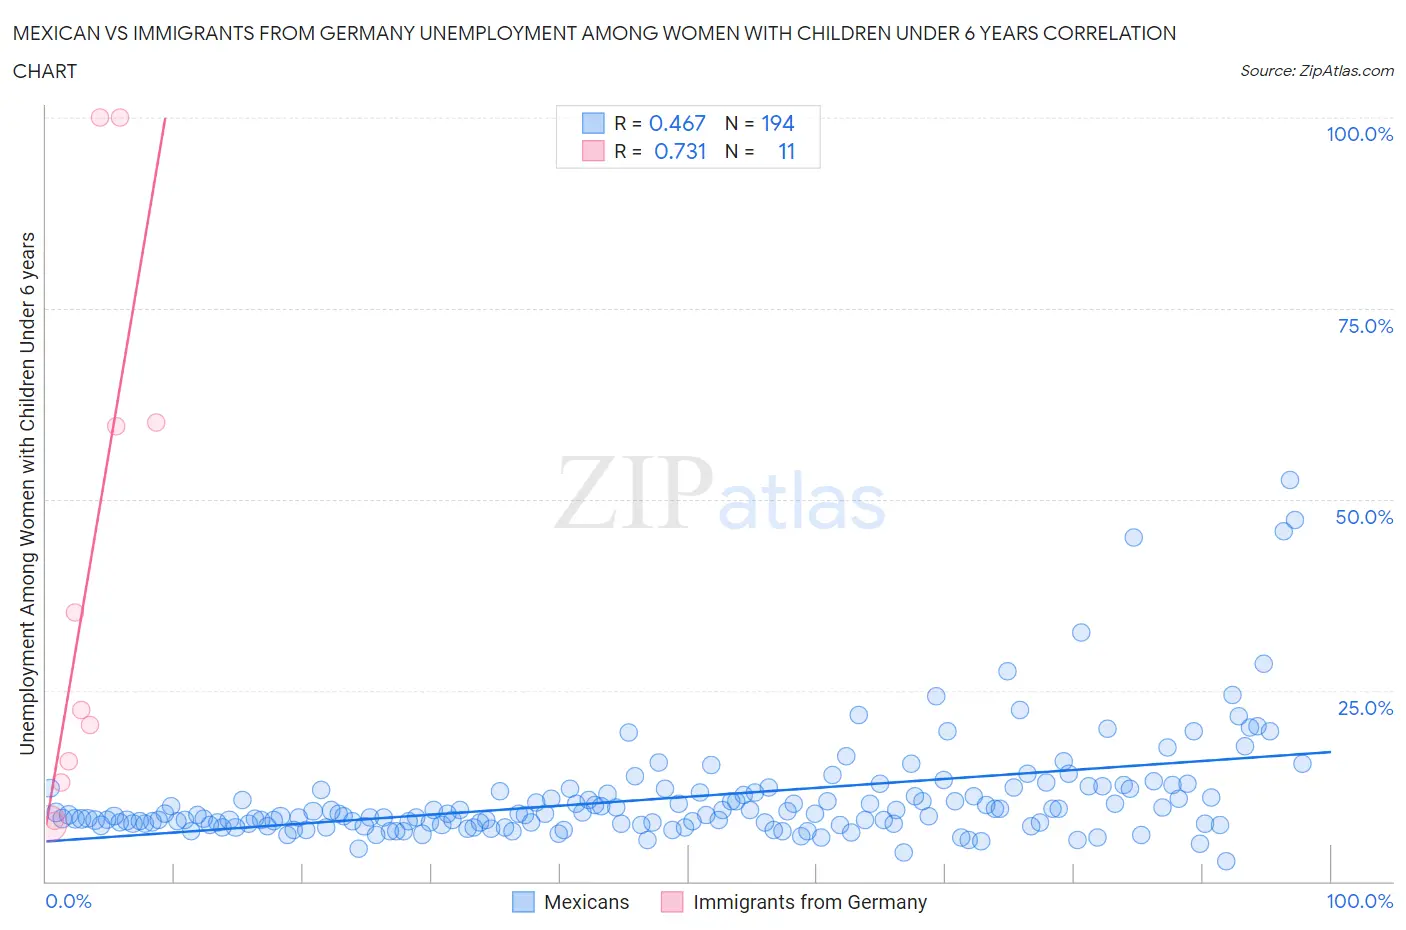
Mexican vs Immigrants from Germany Unemployment Among Women with Children Under 6 years Correlation Chart

The statistical analysis conducted on geographies consisting of 378,149,944 people shows a moderate positive correlation between the proportion of Mexicans and unemployment rate among women with children under the age of 6 in the United States with a correlation coefficient (R) of 0.467 and weighted average of 8.9%. Similarly, the statistical analysis conducted on geographies consisting of 335,343,669 people shows a strong positive correlation between the proportion of Immigrants from Germany and unemployment rate among women with children under the age of 6 in the United States with a correlation coefficient (R) of 0.731 and weighted average of 7.9%, a difference of 11.7%.
Mexican vs Immigrants from Germany Unemployment Among Women with Children Under 6 years

Unemployment Among Women with Children Under 6 years Correlation Summary

MeasurementMexicanImmigrants from Germany
Minimum2.6%7.6%
Maximum52.5%100.0%
Range49.9%92.4%
Mean10.9%40.2%
Median8.7%22.4%
Interquartile 25% (IQ1)7.5%12.9%
Interquartile 75% (IQ3)11.6%60.0%
Interquartile Range (IQR)4.1%47.1%
Standard Deviation (Sample)7.1%34.8%
Standard Deviation (Population)7.0%33.2%

Similar Demographics by Unemployment Among Women with Children Under 6 years

Demographics Similar to Mexicans by Unemployment Among Women with Children Under 6 years

In terms of unemployment among women with children under 6 years, the demographic groups most similar to Mexicans are Immigrants from Dominican Republic (8.9%, a difference of 0.10%), Tlingit-Haida (8.9%, a difference of 0.16%), Immigrants from Central America (8.9%, a difference of 0.23%), Nonimmigrants (8.8%, a difference of 0.27%), and Immigrants from Jamaica (8.9%, a difference of 0.37%).
DemographicsRating | RankUnemployment Among Women with Children Under 6 years
Vietnamese
0.0
/100
|
#290
Tragic
8.8%
Jamaicans
0.0
/100
|
#291
Tragic
8.8%
Cheyenne
0.0
/100
|
#292
Tragic
8.8%
Immigrants | Bangladesh
0.0
/100
|
#293
Tragic
8.8%
Immigrants | Nonimmigrants
0.0
/100
|
#294
Tragic
8.8%
Immigrants | Central America
0.0
/100
|
#295
Tragic
8.9%
Immigrants | Dominican Republic
0.0
/100
|
#296
Tragic
8.9%
Mexicans
0.0
/100
|
#297
Tragic
8.9%
Tlingit-Haida
0.0
/100
|
#298
Tragic
8.9%
Immigrants | Jamaica
0.0
/100
|
#299
Tragic
8.9%
Creek
0.0
/100
|
#300
Tragic
8.9%
Chickasaw
0.0
/100
|
#301
Tragic
9.0%
Hispanics or Latinos
0.0
/100
|
#302
Tragic
9.0%
Immigrants | West Indies
0.0
/100
|
#303
Tragic
9.0%
Immigrants | Mexico
0.0
/100
|
#304
Tragic
9.1%

Demographics Similar to Immigrants from Germany by Unemployment Among Women with Children Under 6 years

In terms of unemployment among women with children under 6 years, the demographic groups most similar to Immigrants from Germany are Samoan (7.9%, a difference of 0.020%), Carpatho Rusyn (8.0%, a difference of 0.15%), South American Indian (7.9%, a difference of 0.16%), Arab (7.9%, a difference of 0.17%), and Moroccan (7.9%, a difference of 0.25%).
DemographicsRating | RankUnemployment Among Women with Children Under 6 years
Spanish
11.3
/100
|
#214
Poor
7.9%
Ecuadorians
11.2
/100
|
#215
Poor
7.9%
Immigrants | Lebanon
11.1
/100
|
#216
Poor
7.9%
Immigrants | Nigeria
10.3
/100
|
#217
Poor
7.9%
Moroccans
9.7
/100
|
#218
Tragic
7.9%
Arabs
9.4
/100
|
#219
Tragic
7.9%
South American Indians
9.3
/100
|
#220
Tragic
7.9%
Immigrants | Germany
8.5
/100
|
#221
Tragic
7.9%
Samoans
8.4
/100
|
#222
Tragic
7.9%
Carpatho Rusyns
7.8
/100
|
#223
Tragic
8.0%
English
7.2
/100
|
#224
Tragic
8.0%
Germans
7.0
/100
|
#225
Tragic
8.0%
Senegalese
6.2
/100
|
#226
Tragic
8.0%
Portuguese
6.2
/100
|
#227
Tragic
8.0%
Immigrants | Sudan
6.0
/100
|
#228
Tragic
8.0%