Mexican American Indian vs Senegalese Unemployment Among Ages 35 to 44 years
COMPARE
Mexican American Indian
Senegalese
Unemployment Among Ages 35 to 44 years
Unemployment Among Ages 35 to 44 years Comparison
Mexican American Indians
Senegalese
5.2%
UNEMPLOYMENT AMONG AGES 35 TO 44 YEARS
0.2/ 100
METRIC RATING
253rd/ 347
METRIC RANK
5.3%
UNEMPLOYMENT AMONG AGES 35 TO 44 YEARS
0.0/ 100
METRIC RATING
272nd/ 347
METRIC RANK
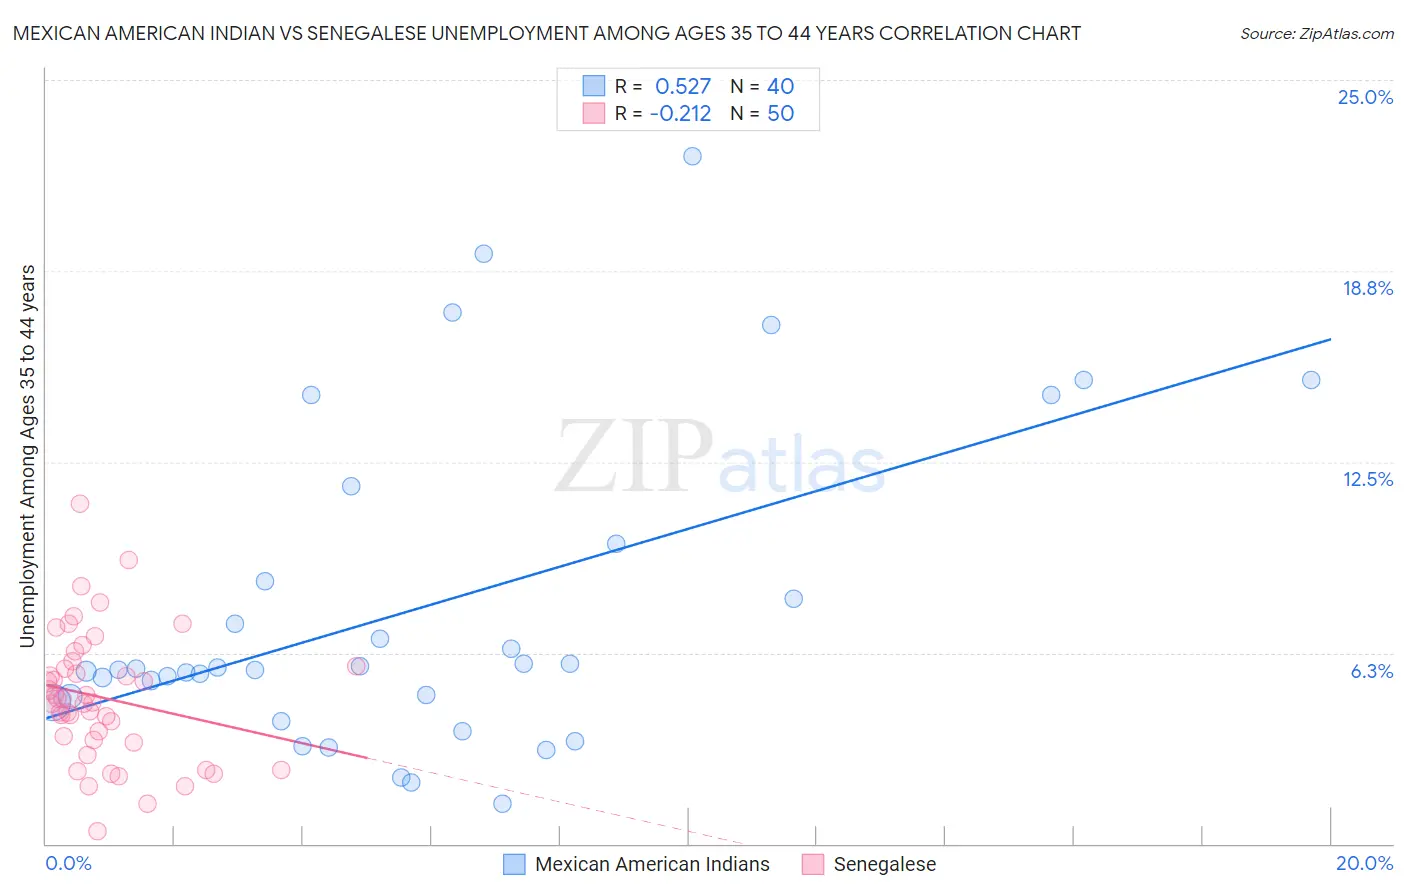
Mexican American Indian vs Senegalese Unemployment Among Ages 35 to 44 years Correlation Chart
The statistical analysis conducted on geographies consisting of 313,187,565 people shows a substantial positive correlation between the proportion of Mexican American Indians and unemployment rate among population between the ages 35 and 44 in the United States with a correlation coefficient (R) of 0.527 and weighted average of 5.2%. Similarly, the statistical analysis conducted on geographies consisting of 77,874,000 people shows a weak negative correlation between the proportion of Senegalese and unemployment rate among population between the ages 35 and 44 in the United States with a correlation coefficient (R) of -0.212 and weighted average of 5.3%, a difference of 2.4%.
Unemployment Among Ages 35 to 44 years Correlation Summary
| Measurement | Mexican American Indian | Senegalese |
| Minimum | 1.3% | 0.40% |
| Maximum | 22.5% | 11.1% |
| Range | 21.2% | 10.7% |
| Mean | 7.7% | 4.8% |
| Median | 5.7% | 4.7% |
| Interquartile 25% (IQ1) | 4.7% | 3.4% |
| Interquartile 75% (IQ3) | 9.2% | 5.8% |
| Interquartile Range (IQR) | 4.5% | 2.4% |
| Standard Deviation (Sample) | 5.2% | 2.1% |
| Standard Deviation (Population) | 5.2% | 2.1% |
Demographics Similar to Mexican American Indians and Senegalese by Unemployment Among Ages 35 to 44 years
In terms of unemployment among ages 35 to 44 years, the demographic groups most similar to Mexican American Indians are Armenian (5.2%, a difference of 0.020%), Immigrants from Bahamas (5.2%, a difference of 0.030%), Cherokee (5.2%, a difference of 0.080%), Seminole (5.2%, a difference of 0.34%), and Immigrants from Fiji (5.3%, a difference of 0.63%). Similarly, the demographic groups most similar to Senegalese are Ute (5.3%, a difference of 0.010%), Blackfeet (5.3%, a difference of 0.18%), Cajun (5.3%, a difference of 0.32%), Hawaiian (5.3%, a difference of 0.33%), and Immigrants from Western Africa (5.3%, a difference of 0.41%).
| Demographics | Rating | Rank | Unemployment Among Ages 35 to 44 years |
| Armenians | 0.2 /100 | #252 | Tragic 5.2% |
| Mexican American Indians | 0.2 /100 | #253 | Tragic 5.2% |
| Immigrants | Bahamas | 0.2 /100 | #254 | Tragic 5.2% |
| Cherokee | 0.2 /100 | #255 | Tragic 5.2% |
| Seminole | 0.1 /100 | #256 | Tragic 5.2% |
| Immigrants | Fiji | 0.1 /100 | #257 | Tragic 5.3% |
| Immigrants | Latin America | 0.1 /100 | #258 | Tragic 5.3% |
| Mexicans | 0.1 /100 | #259 | Tragic 5.3% |
| Sub-Saharan Africans | 0.1 /100 | #260 | Tragic 5.3% |
| Spanish Americans | 0.1 /100 | #261 | Tragic 5.3% |
| Immigrants | Central America | 0.1 /100 | #262 | Tragic 5.3% |
| Choctaw | 0.1 /100 | #263 | Tragic 5.3% |
| Ghanaians | 0.1 /100 | #264 | Tragic 5.3% |
| Yaqui | 0.1 /100 | #265 | Tragic 5.3% |
| Immigrants | Bangladesh | 0.1 /100 | #266 | Tragic 5.3% |
| Immigrants | Western Africa | 0.0 /100 | #267 | Tragic 5.3% |
| Hawaiians | 0.0 /100 | #268 | Tragic 5.3% |
| Cajuns | 0.0 /100 | #269 | Tragic 5.3% |
| Blackfeet | 0.0 /100 | #270 | Tragic 5.3% |
| Ute | 0.0 /100 | #271 | Tragic 5.3% |
| Senegalese | 0.0 /100 | #272 | Tragic 5.3% |