Marshallese vs Immigrants from Croatia Unemployment Among Ages 55 to 59 years
COMPARE
Marshallese
Immigrants from Croatia
Unemployment Among Ages 55 to 59 years
Unemployment Among Ages 55 to 59 years Comparison
Marshallese
Immigrants from Croatia
5.5%
UNEMPLOYMENT AMONG AGES 55 TO 59 YEARS
0.0/ 100
METRIC RATING
303rd/ 347
METRIC RANK
4.8%
UNEMPLOYMENT AMONG AGES 55 TO 59 YEARS
50.0/ 100
METRIC RATING
174th/ 347
METRIC RANK
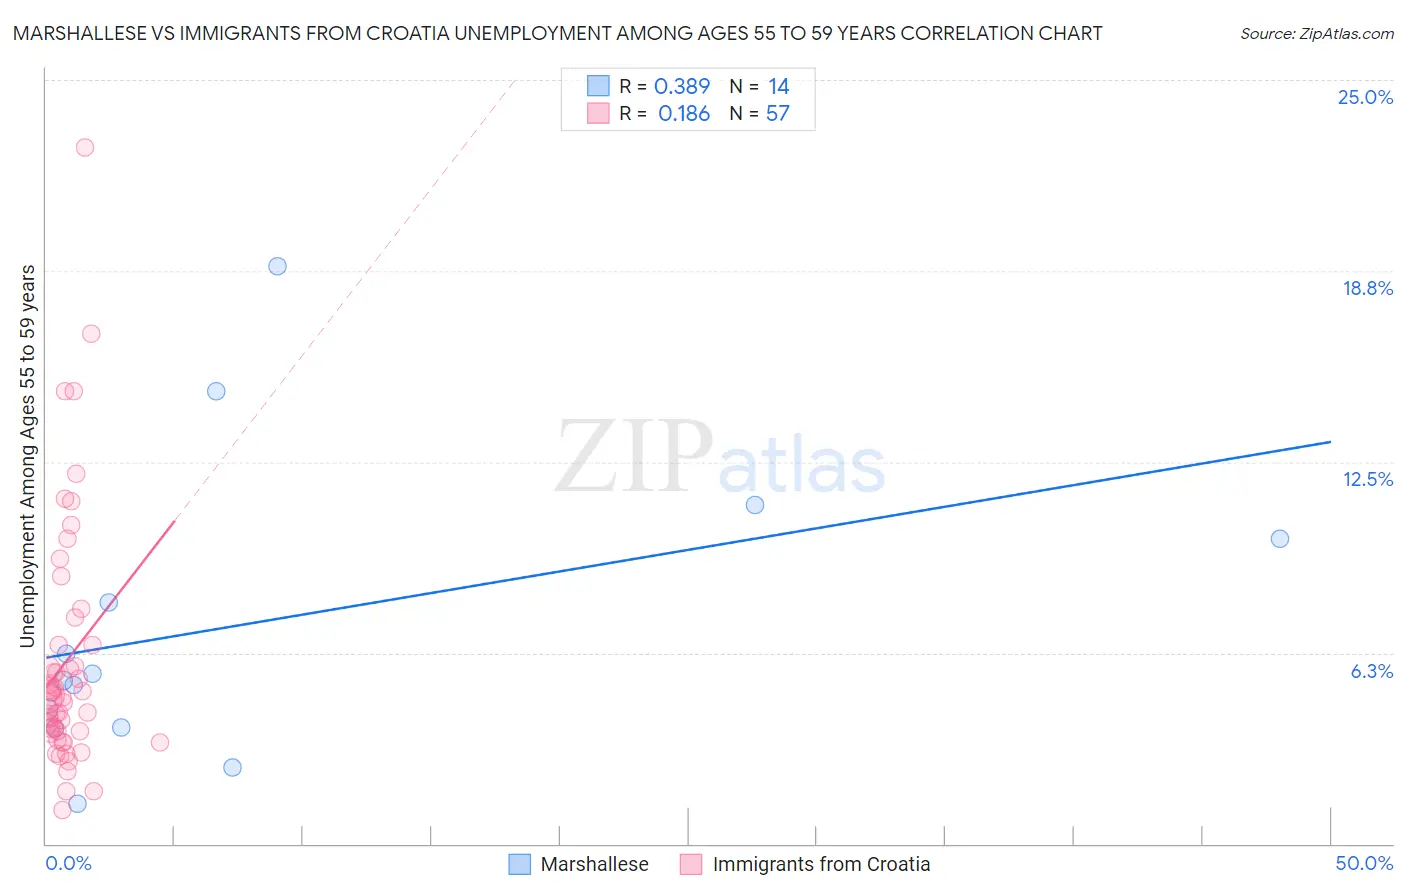
Marshallese vs Immigrants from Croatia Unemployment Among Ages 55 to 59 years Correlation Chart
The statistical analysis conducted on geographies consisting of 14,434,546 people shows a mild positive correlation between the proportion of Marshallese and unemployment rate among population between the ages 55 and 59 in the United States with a correlation coefficient (R) of 0.389 and weighted average of 5.5%. Similarly, the statistical analysis conducted on geographies consisting of 129,667,766 people shows a poor positive correlation between the proportion of Immigrants from Croatia and unemployment rate among population between the ages 55 and 59 in the United States with a correlation coefficient (R) of 0.186 and weighted average of 4.8%, a difference of 13.6%.
Unemployment Among Ages 55 to 59 years Correlation Summary
| Measurement | Marshallese | Immigrants from Croatia |
| Minimum | 1.3% | 1.1% |
| Maximum | 18.9% | 22.8% |
| Range | 17.6% | 21.7% |
| Mean | 7.2% | 6.0% |
| Median | 5.5% | 4.8% |
| Interquartile 25% (IQ1) | 3.8% | 3.6% |
| Interquartile 75% (IQ3) | 10.0% | 6.5% |
| Interquartile Range (IQR) | 6.2% | 2.9% |
| Standard Deviation (Sample) | 4.9% | 4.1% |
| Standard Deviation (Population) | 4.8% | 4.0% |
Similar Demographics by Unemployment Among Ages 55 to 59 years
Demographics Similar to Marshallese by Unemployment Among Ages 55 to 59 years
In terms of unemployment among ages 55 to 59 years, the demographic groups most similar to Marshallese are Sierra Leonean (5.5%, a difference of 0.010%), Immigrants from Dominica (5.5%, a difference of 0.41%), Black/African American (5.5%, a difference of 0.52%), Immigrants from St. Vincent and the Grenadines (5.4%, a difference of 0.65%), and Immigrants from Portugal (5.5%, a difference of 0.70%).
| Demographics | Rating | Rank | Unemployment Among Ages 55 to 59 years |
| Barbadians | 0.0 /100 | #296 | Tragic 5.3% |
| Immigrants | Mexico | 0.0 /100 | #297 | Tragic 5.3% |
| Hispanics or Latinos | 0.0 /100 | #298 | Tragic 5.4% |
| Cape Verdeans | 0.0 /100 | #299 | Tragic 5.4% |
| Immigrants | St. Vincent and the Grenadines | 0.0 /100 | #300 | Tragic 5.4% |
| Immigrants | Dominica | 0.0 /100 | #301 | Tragic 5.5% |
| Sierra Leoneans | 0.0 /100 | #302 | Tragic 5.5% |
| Marshallese | 0.0 /100 | #303 | Tragic 5.5% |
| Blacks/African Americans | 0.0 /100 | #304 | Tragic 5.5% |
| Immigrants | Portugal | 0.0 /100 | #305 | Tragic 5.5% |
| Immigrants | Cabo Verde | 0.0 /100 | #306 | Tragic 5.5% |
| Immigrants | Belize | 0.0 /100 | #307 | Tragic 5.5% |
| Spanish American Indians | 0.0 /100 | #308 | Tragic 5.6% |
| Nepalese | 0.0 /100 | #309 | Tragic 5.6% |
| Belizeans | 0.0 /100 | #310 | Tragic 5.6% |
Demographics Similar to Immigrants from Croatia by Unemployment Among Ages 55 to 59 years
In terms of unemployment among ages 55 to 59 years, the demographic groups most similar to Immigrants from Croatia are Australian (4.8%, a difference of 0.060%), Immigrants from Eastern Europe (4.8%, a difference of 0.090%), Samoan (4.8%, a difference of 0.12%), Immigrants from Sri Lanka (4.8%, a difference of 0.13%), and Nicaraguan (4.8%, a difference of 0.16%).
| Demographics | Rating | Rank | Unemployment Among Ages 55 to 59 years |
| Immigrants | Western Europe | 60.4 /100 | #167 | Good 4.8% |
| Immigrants | Cambodia | 59.3 /100 | #168 | Average 4.8% |
| Immigrants | Sudan | 58.4 /100 | #169 | Average 4.8% |
| Uruguayans | 55.6 /100 | #170 | Average 4.8% |
| Japanese | 54.5 /100 | #171 | Average 4.8% |
| Nicaraguans | 54.0 /100 | #172 | Average 4.8% |
| Immigrants | Eastern Europe | 52.2 /100 | #173 | Average 4.8% |
| Immigrants | Croatia | 50.0 /100 | #174 | Average 4.8% |
| Australians | 48.6 /100 | #175 | Average 4.8% |
| Samoans | 47.1 /100 | #176 | Average 4.8% |
| Immigrants | Sri Lanka | 46.8 /100 | #177 | Average 4.8% |
| Arabs | 44.7 /100 | #178 | Average 4.8% |
| Hungarians | 44.3 /100 | #179 | Average 4.8% |
| South Americans | 44.0 /100 | #180 | Average 4.8% |
| Immigrants | Hungary | 40.4 /100 | #181 | Average 4.8% |