Marshallese vs Belgian Unemployment Among Ages 25 to 29 years
COMPARE
Marshallese
Belgian
Unemployment Among Ages 25 to 29 years
Unemployment Among Ages 25 to 29 years Comparison
Marshallese
Belgians
6.4%
UNEMPLOYMENT AMONG AGES 25 TO 29 YEARS
94.7/ 100
METRIC RATING
87th/ 347
METRIC RANK
6.3%
UNEMPLOYMENT AMONG AGES 25 TO 29 YEARS
97.0/ 100
METRIC RATING
73rd/ 347
METRIC RANK
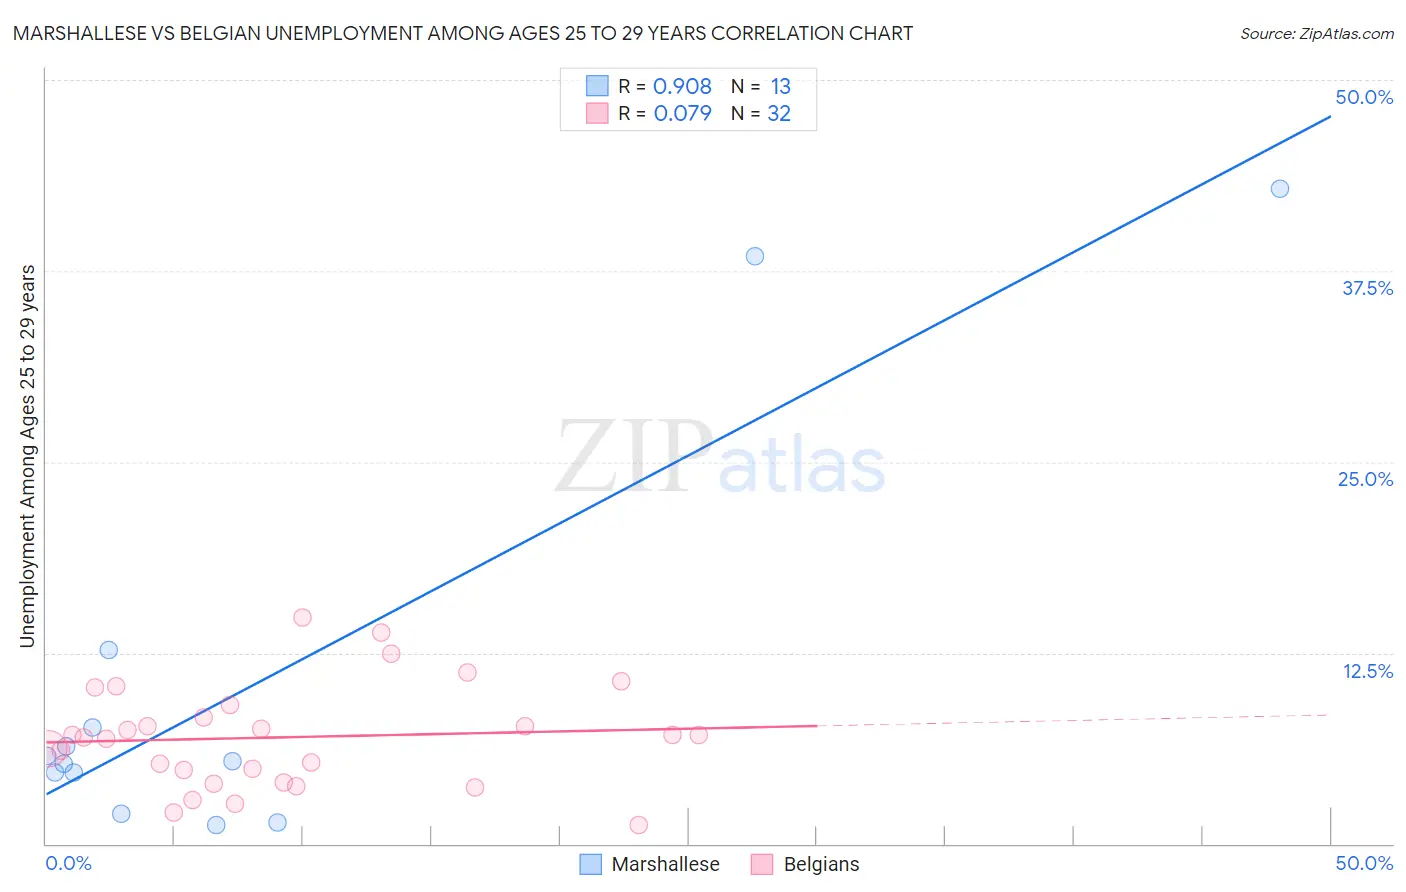
Marshallese vs Belgian Unemployment Among Ages 25 to 29 years Correlation Chart
The statistical analysis conducted on geographies consisting of 14,672,046 people shows a near-perfect positive correlation between the proportion of Marshallese and unemployment rate among population between the ages 25 and 29 in the United States with a correlation coefficient (R) of 0.908 and weighted average of 6.4%. Similarly, the statistical analysis conducted on geographies consisting of 334,915,695 people shows a slight positive correlation between the proportion of Belgians and unemployment rate among population between the ages 25 and 29 in the United States with a correlation coefficient (R) of 0.079 and weighted average of 6.3%, a difference of 0.94%.
Unemployment Among Ages 25 to 29 years Correlation Summary
| Measurement | Marshallese | Belgian |
| Minimum | 1.2% | 1.2% |
| Maximum | 42.9% | 14.8% |
| Range | 41.7% | 13.6% |
| Mean | 10.6% | 7.0% |
| Median | 5.4% | 7.0% |
| Interquartile 25% (IQ1) | 3.3% | 4.4% |
| Interquartile 75% (IQ3) | 10.1% | 8.7% |
| Interquartile Range (IQR) | 6.8% | 4.3% |
| Standard Deviation (Sample) | 13.7% | 3.3% |
| Standard Deviation (Population) | 13.2% | 3.3% |
Demographics Similar to Marshallese and Belgians by Unemployment Among Ages 25 to 29 years
In terms of unemployment among ages 25 to 29 years, the demographic groups most similar to Marshallese are Immigrants from Asia (6.3%, a difference of 0.050%), Immigrants from Indonesia (6.4%, a difference of 0.060%), Immigrants from Sweden (6.3%, a difference of 0.15%), Immigrants from Spain (6.3%, a difference of 0.17%), and Immigrants from Oceania (6.4%, a difference of 0.17%). Similarly, the demographic groups most similar to Belgians are Carpatho Rusyn (6.3%, a difference of 0.020%), Immigrants from Jordan (6.3%, a difference of 0.090%), Immigrants from Korea (6.3%, a difference of 0.16%), Icelander (6.3%, a difference of 0.18%), and Scandinavian (6.3%, a difference of 0.25%).
| Demographics | Rating | Rank | Unemployment Among Ages 25 to 29 years |
| Immigrants | Malaysia | 97.5 /100 | #70 | Exceptional 6.3% |
| Immigrants | France | 97.4 /100 | #71 | Exceptional 6.3% |
| Scandinavians | 97.4 /100 | #72 | Exceptional 6.3% |
| Belgians | 97.0 /100 | #73 | Exceptional 6.3% |
| Carpatho Rusyns | 96.9 /100 | #74 | Exceptional 6.3% |
| Immigrants | Jordan | 96.8 /100 | #75 | Exceptional 6.3% |
| Immigrants | Korea | 96.7 /100 | #76 | Exceptional 6.3% |
| Icelanders | 96.6 /100 | #77 | Exceptional 6.3% |
| Asians | 96.4 /100 | #78 | Exceptional 6.3% |
| Immigrants | Switzerland | 96.0 /100 | #79 | Exceptional 6.3% |
| Immigrants | Romania | 95.9 /100 | #80 | Exceptional 6.3% |
| Iranians | 95.8 /100 | #81 | Exceptional 6.3% |
| Immigrants | Poland | 95.7 /100 | #82 | Exceptional 6.3% |
| Slovenes | 95.3 /100 | #83 | Exceptional 6.3% |
| Immigrants | Spain | 95.2 /100 | #84 | Exceptional 6.3% |
| Immigrants | Sweden | 95.1 /100 | #85 | Exceptional 6.3% |
| Immigrants | Asia | 94.9 /100 | #86 | Exceptional 6.3% |
| Marshallese | 94.7 /100 | #87 | Exceptional 6.4% |
| Immigrants | Indonesia | 94.5 /100 | #88 | Exceptional 6.4% |
| Immigrants | Oceania | 94.1 /100 | #89 | Exceptional 6.4% |
| Lebanese | 93.9 /100 | #90 | Exceptional 6.4% |