Malaysian vs White/Caucasian Unemployment Among Seniors over 65 years
COMPARE
Malaysian
White/Caucasian
Unemployment Among Seniors over 65 years
Unemployment Among Seniors over 65 years Comparison
Malaysians
Whites/Caucasians
5.1%
UNEMPLOYMENT AMONG SENIORS OVER 65 YEARS
90.4/ 100
METRIC RATING
117th/ 347
METRIC RANK
5.1%
UNEMPLOYMENT AMONG SENIORS OVER 65 YEARS
84.4/ 100
METRIC RATING
136th/ 347
METRIC RANK
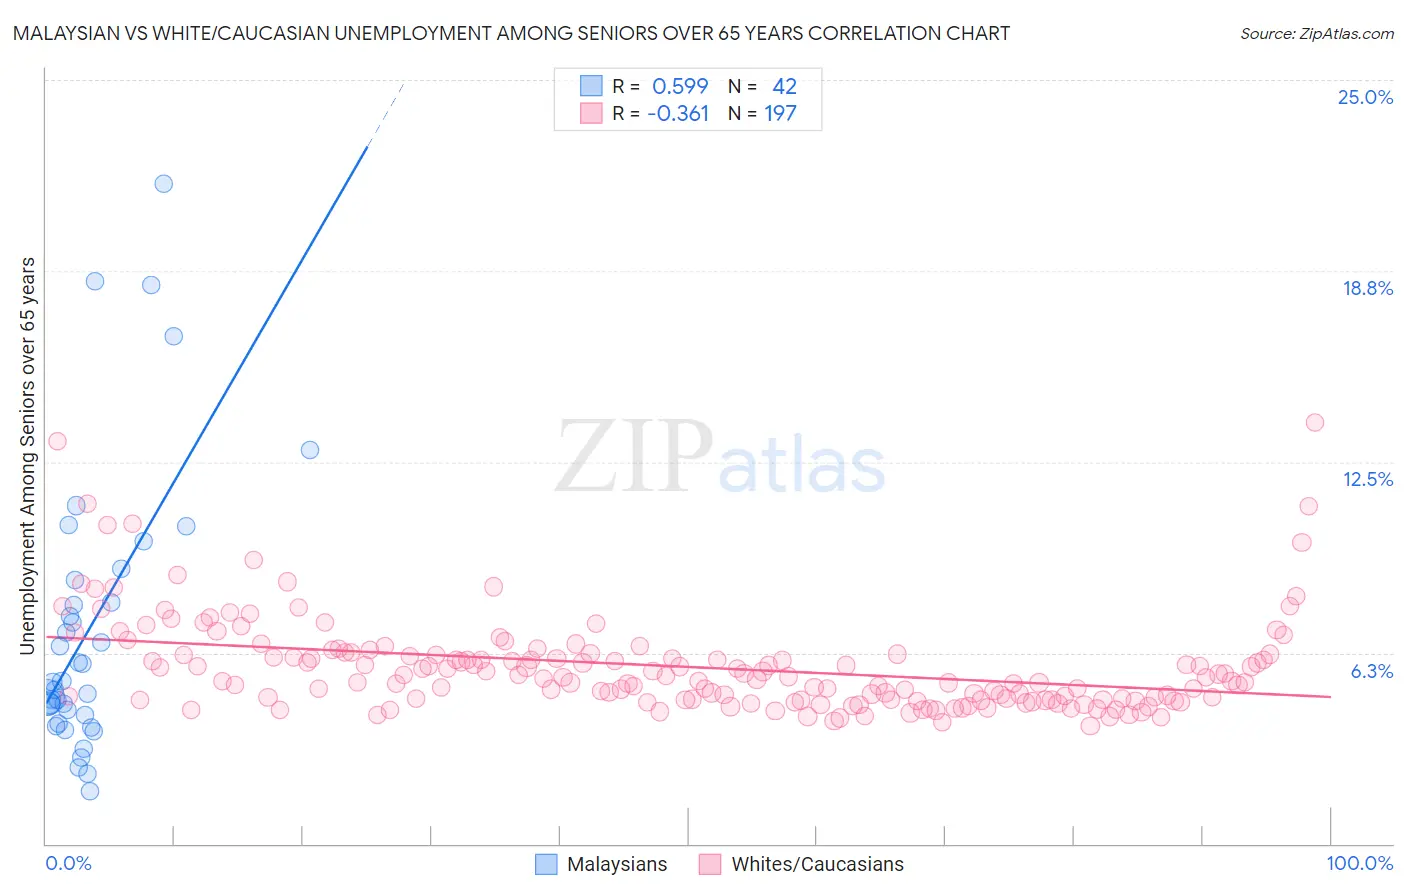
Malaysian vs White/Caucasian Unemployment Among Seniors over 65 years Correlation Chart
The statistical analysis conducted on geographies consisting of 210,872,755 people shows a substantial positive correlation between the proportion of Malaysians and unemployment rate amomg seniors over the age of 65 in the United States with a correlation coefficient (R) of 0.599 and weighted average of 5.1%. Similarly, the statistical analysis conducted on geographies consisting of 465,209,584 people shows a mild negative correlation between the proportion of Whites/Caucasians and unemployment rate amomg seniors over the age of 65 in the United States with a correlation coefficient (R) of -0.361 and weighted average of 5.1%, a difference of 0.46%.
Unemployment Among Seniors over 65 years Correlation Summary
| Measurement | Malaysian | White/Caucasian |
| Minimum | 1.7% | 3.9% |
| Maximum | 21.6% | 13.8% |
| Range | 19.9% | 9.9% |
| Mean | 7.1% | 5.8% |
| Median | 5.3% | 5.5% |
| Interquartile 25% (IQ1) | 4.2% | 4.7% |
| Interquartile 75% (IQ3) | 8.6% | 6.2% |
| Interquartile Range (IQR) | 4.4% | 1.5% |
| Standard Deviation (Sample) | 4.6% | 1.6% |
| Standard Deviation (Population) | 4.6% | 1.6% |
Demographics Similar to Malaysians and Whites/Caucasians by Unemployment Among Seniors over 65 years
In terms of unemployment among seniors over 65 years, the demographic groups most similar to Malaysians are Soviet Union (5.1%, a difference of 0.030%), Immigrants from Korea (5.0%, a difference of 0.060%), Immigrants from Canada (5.1%, a difference of 0.070%), Irish (5.1%, a difference of 0.15%), and Puget Sound Salish (5.1%, a difference of 0.15%). Similarly, the demographic groups most similar to Whites/Caucasians are Ukrainian (5.1%, a difference of 0.0%), Turkish (5.1%, a difference of 0.030%), Syrian (5.1%, a difference of 0.060%), Chilean (5.1%, a difference of 0.080%), and Immigrants from Australia (5.1%, a difference of 0.090%).
| Demographics | Rating | Rank | Unemployment Among Seniors over 65 years |
| Immigrants | Korea | 91.0 /100 | #116 | Exceptional 5.0% |
| Malaysians | 90.4 /100 | #117 | Exceptional 5.1% |
| Soviet Union | 90.1 /100 | #118 | Exceptional 5.1% |
| Immigrants | Canada | 89.7 /100 | #119 | Excellent 5.1% |
| Irish | 88.8 /100 | #120 | Excellent 5.1% |
| Puget Sound Salish | 88.7 /100 | #121 | Excellent 5.1% |
| Immigrants | Cameroon | 88.6 /100 | #122 | Excellent 5.1% |
| Asians | 88.5 /100 | #123 | Excellent 5.1% |
| Immigrants | North America | 87.9 /100 | #124 | Excellent 5.1% |
| Dutch | 87.6 /100 | #125 | Excellent 5.1% |
| Immigrants | Sri Lanka | 87.4 /100 | #126 | Excellent 5.1% |
| Sri Lankans | 87.4 /100 | #127 | Excellent 5.1% |
| Australians | 87.1 /100 | #128 | Excellent 5.1% |
| Immigrants | England | 86.7 /100 | #129 | Excellent 5.1% |
| Iranians | 86.6 /100 | #130 | Excellent 5.1% |
| Immigrants | Australia | 85.8 /100 | #131 | Excellent 5.1% |
| Chileans | 85.6 /100 | #132 | Excellent 5.1% |
| Syrians | 85.3 /100 | #133 | Excellent 5.1% |
| Turks | 84.9 /100 | #134 | Excellent 5.1% |
| Ukrainians | 84.4 /100 | #135 | Excellent 5.1% |
| Whites/Caucasians | 84.4 /100 | #136 | Excellent 5.1% |