Malaysian vs Serbian Unemployment Among Women with Children Under 18 years

COMPARE

Malaysian
Race
Ancestry
AfghanAfricanAlaska NativeAlaskan AthabascanAlbanianAleutAlsatianAmericanApacheArabArapahoArgentineanArmenianAssyrian/Chaldean/SyriacAustralianAustrianBahamianBangladeshiBarbadianBasqueBelgianBelizeanBermudanBhutaneseBlackfeetBolivianBrazilianBritishBritish West IndianBulgarianBurmeseCajunCambodianCanadianCape VerdeanCarpatho RusynCelticCentral AmericanCentral American IndianCherokeeCheyenneChickasawChileanChineseChippewaChoctawColombianColvilleComancheCosta RicanCreeCreekCroatianCrowCubanCypriotCzechCzechoslovakianDanishDelawareDominicanDutchDutch West IndianEastern EuropeanEcuadorianEgyptianEnglishEstonianEthiopianEuropeanFijianFilipinoFinnishFrenchFrench American IndianFrench CanadianGermanGerman RussianGhanaianGreekGuamanian/ChamorroGuatemalanGuyaneseHaitianHmongHonduranHopiHoumaHungarianIcelanderIndian (Asian)IndonesianInupiatIranianIraqiIrishIroquoisIsraeliItalianJamaicanJapaneseJordanianKenyanKiowaKoreanLaotianLatvianLebaneseLiberianLithuanianLumbeeLuxembourgerMacedonianMalaysianMalteseMarshalleseMenomineeMexicanMexican American IndianMongolianMoroccanNative HawaiianNavajoNepaleseNew ZealanderNicaraguanNigerianNorthern EuropeanNorwegianOkinawanOsageOttawaPaiutePakistaniPalestinianPanamanianParaguayanPennsylvania GermanPeruvianPimaPolishPortuguesePotawatomiPuebloPuerto RicanPuget Sound SalishRomanianRussianSalvadoranSamoanScandinavianScotch-IrishScottishSeminoleSenegaleseShoshoneSierra LeoneanSiouxSlavicSlovakSloveneSomaliSouth AfricanSouth AmericanSouth American IndianSoviet UnionSpaniardSpanishSpanish AmericanSpanish American IndianSri LankanSubsaharan AfricanSudaneseSwedishSwissSyrianTaiwaneseThaiTlingit-HaidaTohono O'OdhamTonganTrinidadian and TobagonianTsimshianTurkishU.S. Virgin IslanderUgandanUkrainianUruguayanUteVenezuelanVietnameseWelshWest IndianYakamaYaquiYugoslavianYumanYup'ikZimbabwean
Immigration
NonimmigrantsImmigrantsAfghanistanAfricaAlbaniaArgentinaArmeniaAsiaAustraliaAustriaBahamasBangladeshBarbadosBelarusBelgiumBelizeBoliviaBosnia and HerzegovinaBrazilBulgariaBurma/MyanmarCabo VerdeCambodiaCameroonCanadaCaribbeanCentral AmericaChileChinaColombiaCongoCosta RicaCroatiaCubaCzechoslovakiaDenmarkDominicaDominican RepublicEastern AfricaEastern AsiaEastern EuropeEcuadorEgyptEl SalvadorEnglandEritreaEthiopiaEuropeFijiFranceGermanyGhanaGreeceGrenadaGuatemalaGuyanaHaitiHondurasHong KongHungaryIndiaIndonesiaIranIraqIrelandIsraelItalyJamaicaJapanJordanKazakhstanKenyaKoreaKuwaitLaosLatin AmericaLatviaLebanonLiberiaLithuaniaMalaysiaMexicoMicronesiaMiddle AfricaMoldovaMoroccoNepalNetherlandsNicaraguaNigeriaNorth AmericaNorth MacedoniaNorthern AfricaNorthern EuropeNorwayOceaniaPakistanPanamaPeruPhilippinesPolandPortugalRomaniaRussiaSaudi ArabiaScotlandSenegalSerbiaSierra LeoneSingaporeSomaliaSouth AfricaSouth AmericaSouth Central AsiaSouth Eastern AsiaSouthern EuropeSpainSri LankaSt. Vincent and the GrenadinesSudanSwedenSwitzerlandSyriaTaiwanThailandTrinidad and TobagoTurkeyUgandaUkraineUruguayUzbekistanVenezuelaVietnamWest IndiesWestern AfricaWestern AsiaWestern EuropeYemenZaireZimbabweAzores
Serbian
Race
Ancestry
AfghanAfricanAlaska NativeAlaskan AthabascanAlbanianAleutAlsatianAmericanApacheArabArapahoArgentineanArmenianAssyrian/Chaldean/SyriacAustralianAustrianBahamianBangladeshiBarbadianBasqueBelgianBelizeanBermudanBhutaneseBlackfeetBolivianBrazilianBritishBritish West IndianBulgarianBurmeseCajunCambodianCanadianCape VerdeanCarpatho RusynCelticCentral AmericanCentral American IndianCherokeeCheyenneChickasawChileanChineseChippewaChoctawColombianColvilleComancheCosta RicanCreeCreekCroatianCrowCubanCypriotCzechCzechoslovakianDanishDelawareDominicanDutchDutch West IndianEastern EuropeanEcuadorianEgyptianEnglishEstonianEthiopianEuropeanFijianFilipinoFinnishFrenchFrench American IndianFrench CanadianGermanGerman RussianGhanaianGreekGuamanian/ChamorroGuatemalanGuyaneseHaitianHmongHonduranHopiHoumaHungarianIcelanderIndian (Asian)IndonesianInupiatIranianIraqiIrishIroquoisIsraeliItalianJamaicanJapaneseJordanianKenyanKiowaKoreanLaotianLatvianLebaneseLiberianLithuanianLumbeeLuxembourgerMacedonianMalteseMarshalleseMenomineeMexicanMexican American IndianMongolianMoroccanNative HawaiianNavajoNepaleseNew ZealanderNicaraguanNigerianNorthern EuropeanNorwegianOkinawanOsageOttawaPaiutePakistaniPalestinianPanamanianParaguayanPennsylvania GermanPeruvianPimaPolishPortuguesePotawatomiPuebloPuerto RicanPuget Sound SalishRomanianRussianSalvadoranSamoanScandinavianScotch-IrishScottishSeminoleSenegaleseSerbianShoshoneSierra LeoneanSiouxSlavicSlovakSloveneSomaliSouth AfricanSouth AmericanSouth American IndianSoviet UnionSpaniardSpanishSpanish AmericanSpanish American IndianSri LankanSubsaharan AfricanSudaneseSwedishSwissSyrianTaiwaneseThaiTlingit-HaidaTohono O'OdhamTonganTrinidadian and TobagonianTsimshianTurkishU.S. Virgin IslanderUgandanUkrainianUruguayanUteVenezuelanVietnameseWelshWest IndianYakamaYaquiYugoslavianYumanYup'ikZimbabwean
Immigration
NonimmigrantsImmigrantsAfghanistanAfricaAlbaniaArgentinaArmeniaAsiaAustraliaAustriaBahamasBangladeshBarbadosBelarusBelgiumBelizeBoliviaBosnia and HerzegovinaBrazilBulgariaBurma/MyanmarCabo VerdeCambodiaCameroonCanadaCaribbeanCentral AmericaChileChinaColombiaCongoCosta RicaCroatiaCubaCzechoslovakiaDenmarkDominicaDominican RepublicEastern AfricaEastern AsiaEastern EuropeEcuadorEgyptEl SalvadorEnglandEritreaEthiopiaEuropeFijiFranceGermanyGhanaGreeceGrenadaGuatemalaGuyanaHaitiHondurasHong KongHungaryIndiaIndonesiaIranIraqIrelandIsraelItalyJamaicaJapanJordanKazakhstanKenyaKoreaKuwaitLaosLatin AmericaLatviaLebanonLiberiaLithuaniaMalaysiaMexicoMicronesiaMiddle AfricaMoldovaMoroccoNepalNetherlandsNicaraguaNigeriaNorth AmericaNorth MacedoniaNorthern AfricaNorthern EuropeNorwayOceaniaPakistanPanamaPeruPhilippinesPolandPortugalRomaniaRussiaSaudi ArabiaScotlandSenegalSerbiaSierra LeoneSingaporeSomaliaSouth AfricaSouth AmericaSouth Central AsiaSouth Eastern AsiaSouthern EuropeSpainSri LankaSt. Vincent and the GrenadinesSudanSwedenSwitzerlandSyriaTaiwanThailandTrinidad and TobagoTurkeyUgandaUkraineUruguayUzbekistanVenezuelaVietnamWest IndiesWestern AfricaWestern AsiaWestern EuropeYemenZaireZimbabweAzores
Unemployment Among Women with Children Under 18 years
Income
Poverty
Unemployment
Labor Participation
Family Structure
Vehicle Availability
Education Level
Disability

Unemployment Among Women with Children Under 18 years Comparison

Malaysians

Serbians

Fair
Exceptional
5.5%
UNEMPLOYMENT AMONG WOMEN WITH CHILDREN UNDER 18 YEARS
35.7/ 100
METRIC RATING
187th/ 347
METRIC RANK
5.1%
UNEMPLOYMENT AMONG WOMEN WITH CHILDREN UNDER 18 YEARS
96.5/ 100
METRIC RATING
71st/ 347
METRIC RANK

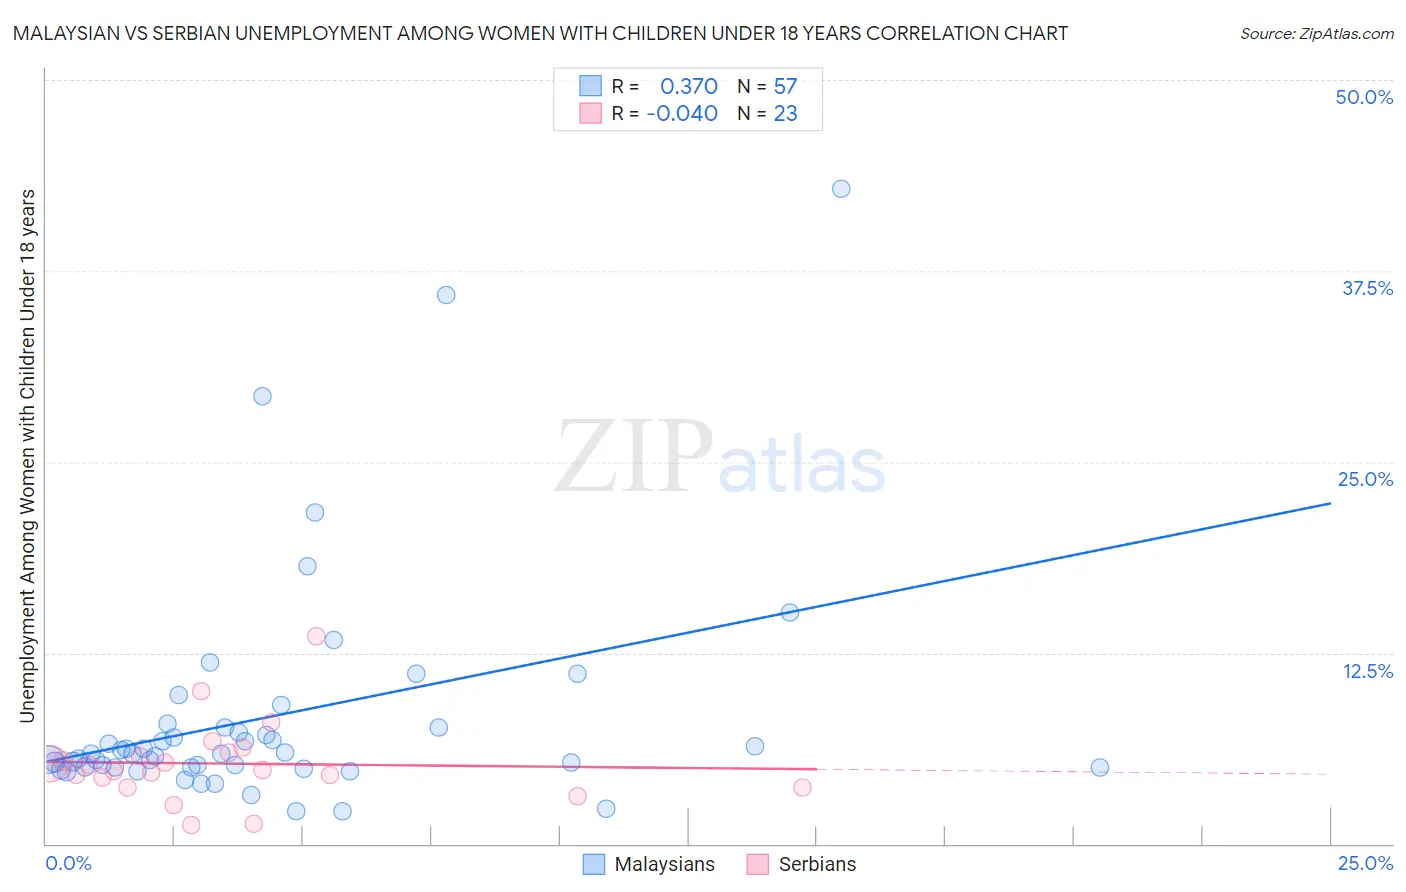
Malaysian vs Serbian Unemployment Among Women with Children Under 18 years Correlation Chart

The statistical analysis conducted on geographies consisting of 221,588,740 people shows a mild positive correlation between the proportion of Malaysians and unemployment rate among women with children under the age of 18 in the United States with a correlation coefficient (R) of 0.370 and weighted average of 5.5%. Similarly, the statistical analysis conducted on geographies consisting of 258,896,879 people shows no correlation between the proportion of Serbians and unemployment rate among women with children under the age of 18 in the United States with a correlation coefficient (R) of -0.040 and weighted average of 5.1%, a difference of 7.4%.
Malaysian vs Serbian Unemployment Among Women with Children Under 18 years

Unemployment Among Women with Children Under 18 years Correlation Summary

MeasurementMalaysianSerbian
Minimum2.1%1.2%
Maximum42.9%13.6%
Range40.8%12.4%
Mean8.3%5.2%
Median5.9%4.8%
Interquartile 25% (IQ1)5.0%3.7%
Interquartile 75% (IQ3)7.6%6.0%
Interquartile Range (IQR)2.6%2.3%
Standard Deviation (Sample)7.6%2.6%
Standard Deviation (Population)7.5%2.6%

Similar Demographics by Unemployment Among Women with Children Under 18 years

Demographics Similar to Malaysians by Unemployment Among Women with Children Under 18 years

In terms of unemployment among women with children under 18 years, the demographic groups most similar to Malaysians are Iraqi (5.5%, a difference of 0.030%), Indonesian (5.5%, a difference of 0.050%), Immigrants from Eritrea (5.5%, a difference of 0.15%), Immigrants from Zaire (5.5%, a difference of 0.18%), and Immigrants from Cambodia (5.5%, a difference of 0.21%).
DemographicsRating | RankUnemployment Among Women with Children Under 18 years
Immigrants | Southern Europe
42.7
/100
|
#180
Average
5.5%
Immigrants | Hungary
41.3
/100
|
#181
Average
5.5%
Immigrants | Sudan
40.6
/100
|
#182
Average
5.5%
Immigrants | Laos
38.8
/100
|
#183
Fair
5.5%
Immigrants | Cambodia
38.4
/100
|
#184
Fair
5.5%
Immigrants | Zaire
38.1
/100
|
#185
Fair
5.5%
Indonesians
36.3
/100
|
#186
Fair
5.5%
Malaysians
35.7
/100
|
#187
Fair
5.5%
Iraqis
35.3
/100
|
#188
Fair
5.5%
Immigrants | Eritrea
33.8
/100
|
#189
Fair
5.5%
Immigrants | Poland
31.2
/100
|
#190
Fair
5.5%
South American Indians
30.8
/100
|
#191
Fair
5.5%
Immigrants | Spain
30.7
/100
|
#192
Fair
5.5%
Immigrants | Afghanistan
29.3
/100
|
#193
Fair
5.5%
Immigrants | Chile
29.2
/100
|
#194
Fair
5.5%

Demographics Similar to Serbians by Unemployment Among Women with Children Under 18 years

In terms of unemployment among women with children under 18 years, the demographic groups most similar to Serbians are Austrian (5.1%, a difference of 0.040%), Icelander (5.1%, a difference of 0.040%), Irish (5.1%, a difference of 0.18%), Immigrants from Bolivia (5.1%, a difference of 0.22%), and Fijian (5.1%, a difference of 0.27%).
DemographicsRating | RankUnemployment Among Women with Children Under 18 years
Estonians
97.2
/100
|
#64
Exceptional
5.1%
Immigrants | Sweden
97.1
/100
|
#65
Exceptional
5.1%
Immigrants | Australia
97.0
/100
|
#66
Exceptional
5.1%
Fijians
96.9
/100
|
#67
Exceptional
5.1%
Irish
96.8
/100
|
#68
Exceptional
5.1%
Austrians
96.6
/100
|
#69
Exceptional
5.1%
Icelanders
96.6
/100
|
#70
Exceptional
5.1%
Serbians
96.5
/100
|
#71
Exceptional
5.1%
Immigrants | Bolivia
96.1
/100
|
#72
Exceptional
5.1%
Albanians
95.9
/100
|
#73
Exceptional
5.1%
Immigrants | Northern Europe
95.9
/100
|
#74
Exceptional
5.1%
Immigrants | Asia
95.8
/100
|
#75
Exceptional
5.1%
Puget Sound Salish
95.8
/100
|
#76
Exceptional
5.1%
Zimbabweans
95.7
/100
|
#77
Exceptional
5.1%
Assyrians/Chaldeans/Syriacs
95.7
/100
|
#78
Exceptional
5.1%