Malaysian vs Immigrants from Sudan Female Unemployment
COMPARE
Malaysian
Immigrants from Sudan
Female Unemployment
Female Unemployment Comparison
Malaysians
Immigrants from Sudan
5.3%
FEMALE UNEMPLOYMENT
40.1/ 100
METRIC RATING
185th/ 347
METRIC RANK
5.0%
FEMALE UNEMPLOYMENT
96.7/ 100
METRIC RATING
88th/ 347
METRIC RANK
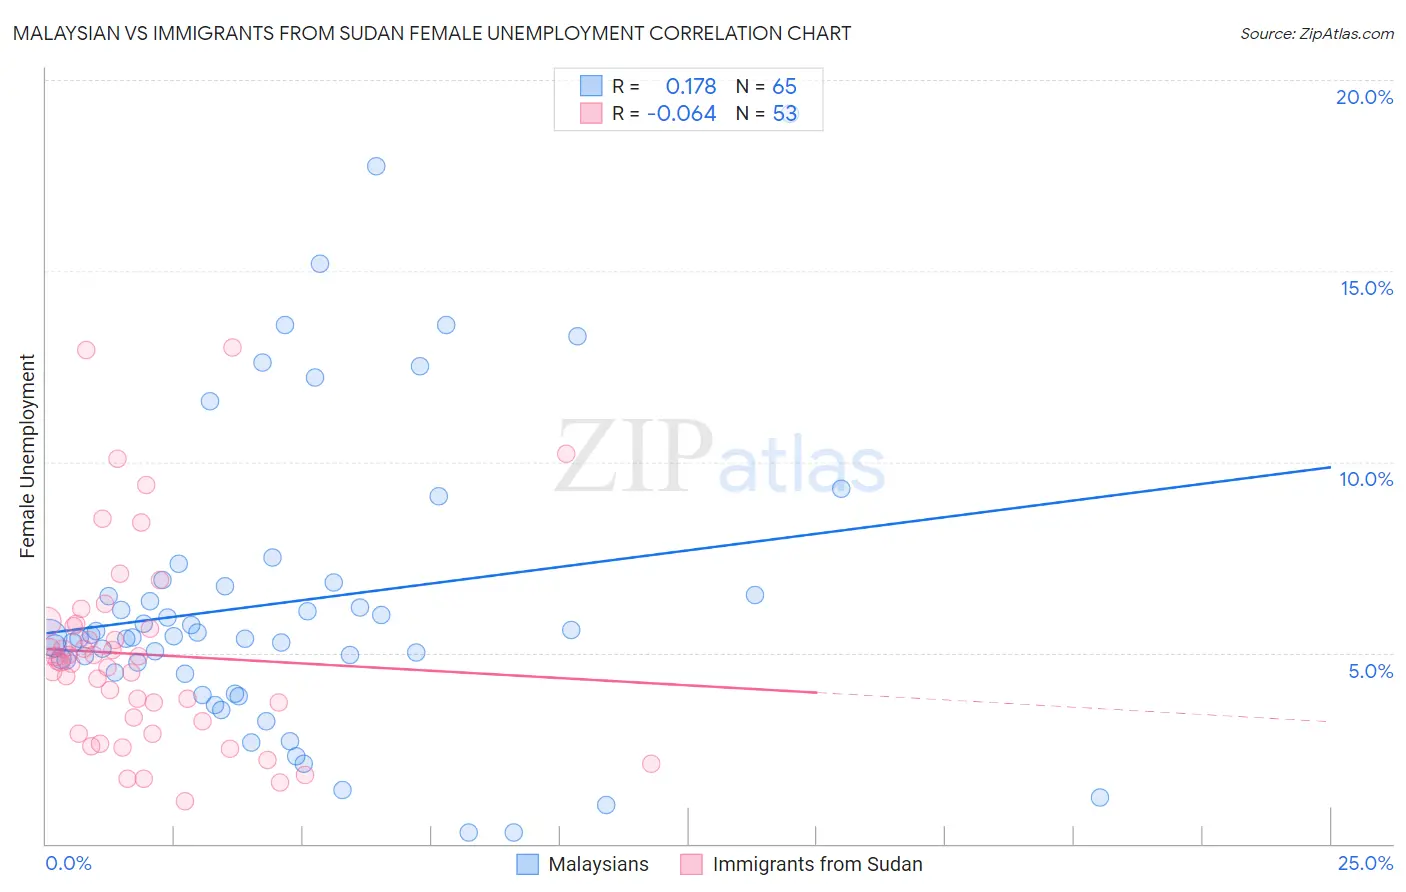
Malaysian vs Immigrants from Sudan Female Unemployment Correlation Chart
The statistical analysis conducted on geographies consisting of 225,706,419 people shows a poor positive correlation between the proportion of Malaysians and unemploymnet rate among females in the United States with a correlation coefficient (R) of 0.178 and weighted average of 5.3%. Similarly, the statistical analysis conducted on geographies consisting of 118,886,024 people shows a slight negative correlation between the proportion of Immigrants from Sudan and unemploymnet rate among females in the United States with a correlation coefficient (R) of -0.064 and weighted average of 5.0%, a difference of 6.0%.
Female Unemployment Correlation Summary
| Measurement | Malaysian | Immigrants from Sudan |
| Minimum | 0.30% | 1.1% |
| Maximum | 19.1% | 13.0% |
| Range | 18.8% | 11.9% |
| Mean | 6.3% | 5.0% |
| Median | 5.4% | 4.7% |
| Interquartile 25% (IQ1) | 4.5% | 3.0% |
| Interquartile 75% (IQ3) | 6.8% | 5.7% |
| Interquartile Range (IQR) | 2.3% | 2.7% |
| Standard Deviation (Sample) | 3.9% | 2.6% |
| Standard Deviation (Population) | 3.9% | 2.6% |
Similar Demographics by Female Unemployment
Demographics Similar to Malaysians by Female Unemployment
In terms of female unemployment, the demographic groups most similar to Malaysians are Immigrants from Ukraine (5.3%, a difference of 0.010%), Immigrants from Indonesia (5.3%, a difference of 0.040%), Immigrants from Belarus (5.3%, a difference of 0.040%), Taiwanese (5.3%, a difference of 0.16%), and Nonimmigrants (5.3%, a difference of 0.16%).
| Demographics | Rating | Rank | Female Unemployment |
| Immigrants | Southern Europe | 46.2 /100 | #178 | Average 5.3% |
| Laotians | 45.1 /100 | #179 | Average 5.3% |
| Immigrants | Congo | 43.1 /100 | #180 | Average 5.3% |
| Taiwanese | 42.7 /100 | #181 | Average 5.3% |
| Immigrants | Nonimmigrants | 42.6 /100 | #182 | Average 5.3% |
| Immigrants | Indonesia | 40.7 /100 | #183 | Average 5.3% |
| Immigrants | Ukraine | 40.1 /100 | #184 | Average 5.3% |
| Malaysians | 40.1 /100 | #185 | Average 5.3% |
| Immigrants | Belarus | 39.4 /100 | #186 | Fair 5.3% |
| Immigrants | Albania | 35.4 /100 | #187 | Fair 5.3% |
| Afghans | 33.9 /100 | #188 | Fair 5.3% |
| Costa Ricans | 33.8 /100 | #189 | Fair 5.3% |
| Ugandans | 31.2 /100 | #190 | Fair 5.3% |
| Cherokee | 30.8 /100 | #191 | Fair 5.3% |
| Portuguese | 28.6 /100 | #192 | Fair 5.3% |
Demographics Similar to Immigrants from Sudan by Female Unemployment
In terms of female unemployment, the demographic groups most similar to Immigrants from Sudan are Immigrants from Taiwan (5.0%, a difference of 0.060%), Venezuelan (5.0%, a difference of 0.090%), Bolivian (5.0%, a difference of 0.18%), Ukrainian (5.0%, a difference of 0.19%), and Immigrants from Sweden (5.0%, a difference of 0.22%).
| Demographics | Rating | Rank | Female Unemployment |
| Filipinos | 97.3 /100 | #81 | Exceptional 5.0% |
| Immigrants | Australia | 97.3 /100 | #82 | Exceptional 5.0% |
| Immigrants | Serbia | 97.2 /100 | #83 | Exceptional 5.0% |
| Canadians | 97.2 /100 | #84 | Exceptional 5.0% |
| Ukrainians | 97.1 /100 | #85 | Exceptional 5.0% |
| Bolivians | 97.1 /100 | #86 | Exceptional 5.0% |
| Venezuelans | 96.9 /100 | #87 | Exceptional 5.0% |
| Immigrants | Sudan | 96.7 /100 | #88 | Exceptional 5.0% |
| Immigrants | Taiwan | 96.6 /100 | #89 | Exceptional 5.0% |
| Immigrants | Sweden | 96.3 /100 | #90 | Exceptional 5.0% |
| Immigrants | Japan | 96.0 /100 | #91 | Exceptional 5.0% |
| Romanians | 95.9 /100 | #92 | Exceptional 5.0% |
| Immigrants | Austria | 95.7 /100 | #93 | Exceptional 5.0% |
| Immigrants | Malaysia | 95.7 /100 | #94 | Exceptional 5.0% |
| Burmese | 95.6 /100 | #95 | Exceptional 5.0% |