Malaysian vs Immigrants from Italy Male Unemployment
COMPARE
Malaysian
Immigrants from Italy
Male Unemployment
Male Unemployment Comparison
Malaysians
Immigrants from Italy
5.3%
MALE UNEMPLOYMENT
39.6/ 100
METRIC RATING
180th/ 347
METRIC RANK
5.2%
MALE UNEMPLOYMENT
76.3/ 100
METRIC RATING
148th/ 347
METRIC RANK
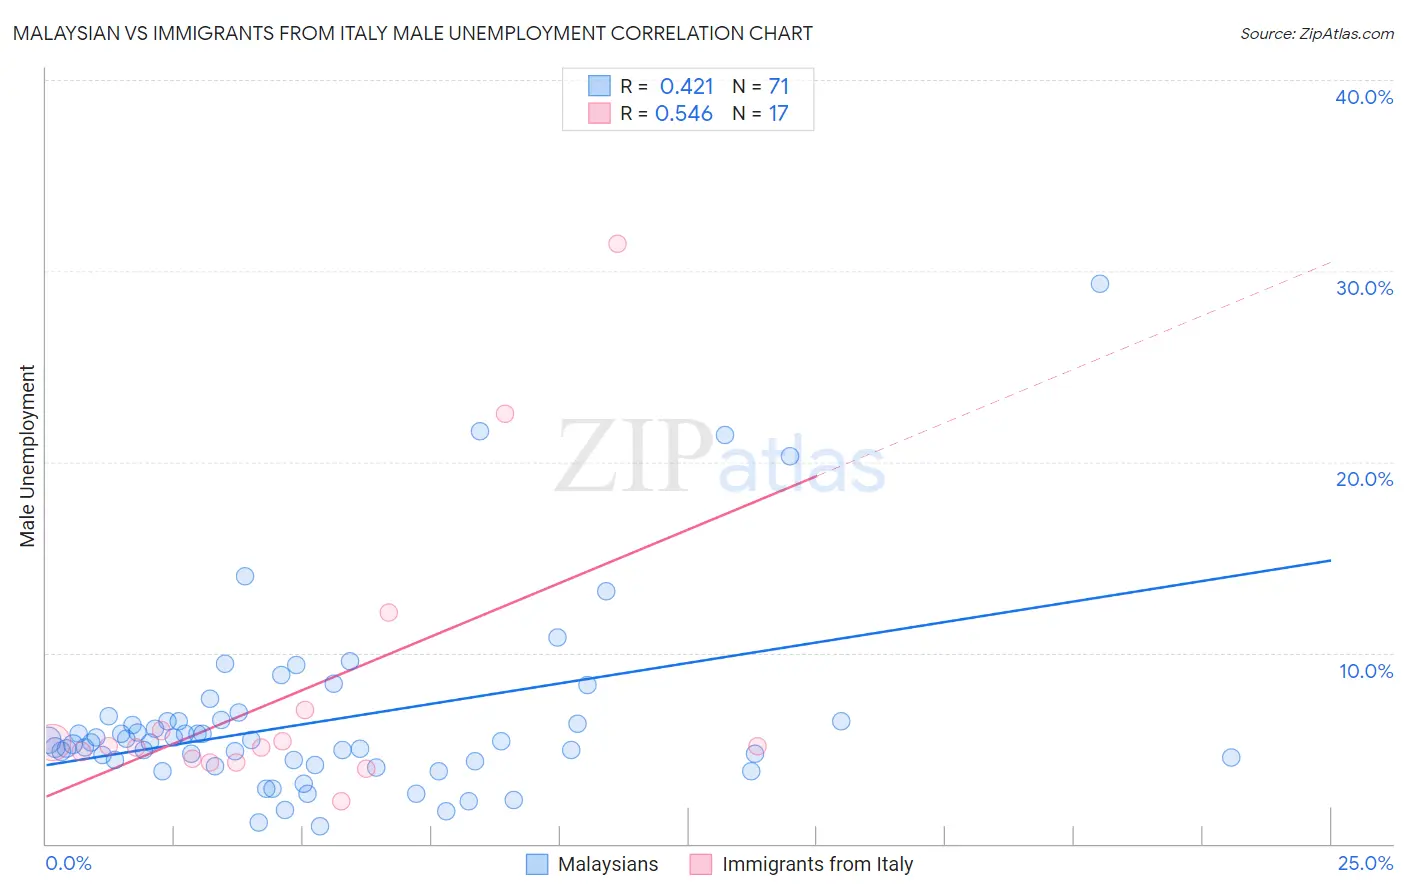
Malaysian vs Immigrants from Italy Male Unemployment Correlation Chart
The statistical analysis conducted on geographies consisting of 225,737,190 people shows a moderate positive correlation between the proportion of Malaysians and unemployment rate among males in the United States with a correlation coefficient (R) of 0.421 and weighted average of 5.3%. Similarly, the statistical analysis conducted on geographies consisting of 323,258,281 people shows a substantial positive correlation between the proportion of Immigrants from Italy and unemployment rate among males in the United States with a correlation coefficient (R) of 0.546 and weighted average of 5.2%, a difference of 2.4%.
Male Unemployment Correlation Summary
| Measurement | Malaysian | Immigrants from Italy |
| Minimum | 0.90% | 2.2% |
| Maximum | 29.3% | 31.4% |
| Range | 28.4% | 29.2% |
| Mean | 6.4% | 7.9% |
| Median | 5.3% | 5.1% |
| Interquartile 25% (IQ1) | 4.3% | 4.4% |
| Interquartile 75% (IQ3) | 6.4% | 6.5% |
| Interquartile Range (IQR) | 2.1% | 2.1% |
| Standard Deviation (Sample) | 4.8% | 7.6% |
| Standard Deviation (Population) | 4.8% | 7.4% |
Similar Demographics by Male Unemployment
Demographics Similar to Malaysians by Male Unemployment
In terms of male unemployment, the demographic groups most similar to Malaysians are Immigrants from Oceania (5.3%, a difference of 0.070%), Immigrants from Afghanistan (5.3%, a difference of 0.10%), Potawatomi (5.3%, a difference of 0.11%), Taiwanese (5.3%, a difference of 0.12%), and Osage (5.3%, a difference of 0.17%).
| Demographics | Rating | Rank | Male Unemployment |
| Immigrants | Russia | 50.7 /100 | #173 | Average 5.3% |
| Immigrants | Iran | 50.0 /100 | #174 | Average 5.3% |
| Immigrants | Iraq | 48.1 /100 | #175 | Average 5.3% |
| Immigrants | Poland | 46.0 /100 | #176 | Average 5.3% |
| Immigrants | Peru | 44.6 /100 | #177 | Average 5.3% |
| Osage | 42.5 /100 | #178 | Average 5.3% |
| Immigrants | Oceania | 40.8 /100 | #179 | Average 5.3% |
| Malaysians | 39.6 /100 | #180 | Fair 5.3% |
| Immigrants | Afghanistan | 37.9 /100 | #181 | Fair 5.3% |
| Potawatomi | 37.8 /100 | #182 | Fair 5.3% |
| Taiwanese | 37.6 /100 | #183 | Fair 5.3% |
| Spaniards | 35.1 /100 | #184 | Fair 5.3% |
| Koreans | 34.9 /100 | #185 | Fair 5.3% |
| Iraqis | 31.6 /100 | #186 | Fair 5.4% |
| Costa Ricans | 31.3 /100 | #187 | Fair 5.4% |
Demographics Similar to Immigrants from Italy by Male Unemployment
In terms of male unemployment, the demographic groups most similar to Immigrants from Italy are Immigrants from Europe (5.2%, a difference of 0.010%), Indian (Asian) (5.2%, a difference of 0.030%), Slovak (5.2%, a difference of 0.060%), Immigrants from Burma/Myanmar (5.2%, a difference of 0.10%), and Immigrants from Kenya (5.2%, a difference of 0.11%).
| Demographics | Rating | Rank | Male Unemployment |
| Immigrants | Switzerland | 79.2 /100 | #141 | Good 5.2% |
| Fijians | 78.3 /100 | #142 | Good 5.2% |
| Syrians | 78.0 /100 | #143 | Good 5.2% |
| Sri Lankans | 77.9 /100 | #144 | Good 5.2% |
| Macedonians | 77.7 /100 | #145 | Good 5.2% |
| Immigrants | Kenya | 77.6 /100 | #146 | Good 5.2% |
| Immigrants | Burma/Myanmar | 77.5 /100 | #147 | Good 5.2% |
| Immigrants | Italy | 76.3 /100 | #148 | Good 5.2% |
| Immigrants | Europe | 76.2 /100 | #149 | Good 5.2% |
| Indians (Asian) | 76.0 /100 | #150 | Good 5.2% |
| Slovaks | 75.5 /100 | #151 | Good 5.2% |
| Egyptians | 74.8 /100 | #152 | Good 5.2% |
| Immigrants | Uruguay | 73.9 /100 | #153 | Good 5.2% |
| Laotians | 73.8 /100 | #154 | Good 5.2% |
| Immigrants | Hungary | 73.4 /100 | #155 | Good 5.2% |