Malaysian vs Czech Unemployment Among Women with Children Under 6 years
COMPARE
Malaysian
Czech
Unemployment Among Women with Children Under 6 years
Unemployment Among Women with Children Under 6 years Comparison
Malaysians
Czechs
7.7%
UNEMPLOYMENT AMONG WOMEN WITH CHILDREN UNDER 6 YEARS
31.1/ 100
METRIC RATING
195th/ 347
METRIC RANK
7.6%
UNEMPLOYMENT AMONG WOMEN WITH CHILDREN UNDER 6 YEARS
59.8/ 100
METRIC RATING
170th/ 347
METRIC RANK
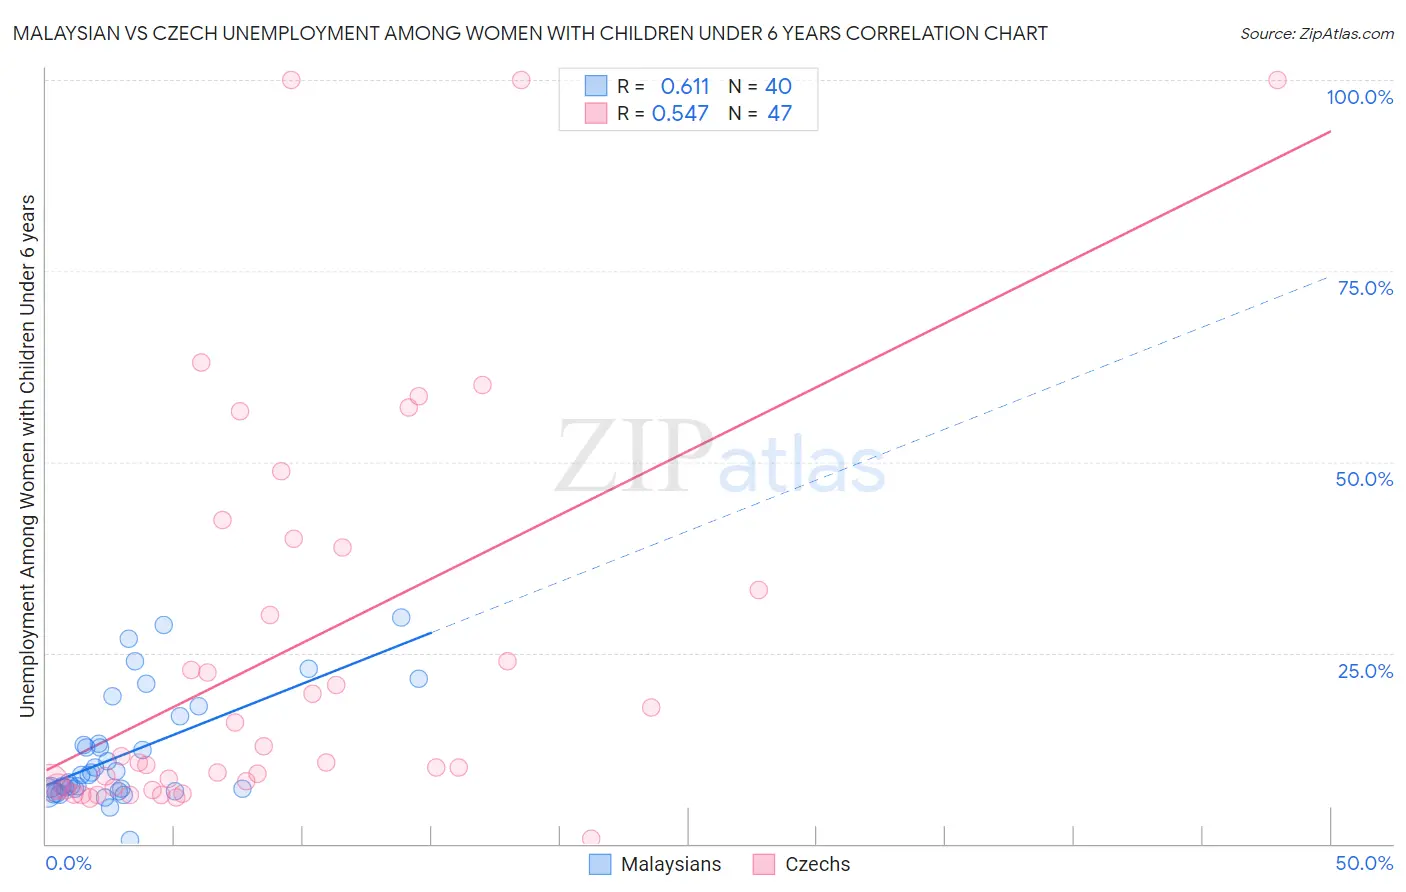
Malaysian vs Czech Unemployment Among Women with Children Under 6 years Correlation Chart
The statistical analysis conducted on geographies consisting of 189,834,116 people shows a significant positive correlation between the proportion of Malaysians and unemployment rate among women with children under the age of 6 in the United States with a correlation coefficient (R) of 0.611 and weighted average of 7.7%. Similarly, the statistical analysis conducted on geographies consisting of 337,488,304 people shows a substantial positive correlation between the proportion of Czechs and unemployment rate among women with children under the age of 6 in the United States with a correlation coefficient (R) of 0.547 and weighted average of 7.6%, a difference of 2.0%.
Unemployment Among Women with Children Under 6 years Correlation Summary
| Measurement | Malaysian | Czech |
| Minimum | 0.50% | 0.70% |
| Maximum | 29.7% | 100.0% |
| Range | 29.2% | 99.3% |
| Mean | 11.9% | 25.1% |
| Median | 9.0% | 10.7% |
| Interquartile 25% (IQ1) | 7.0% | 7.4% |
| Interquartile 75% (IQ3) | 14.9% | 38.8% |
| Interquartile Range (IQR) | 7.8% | 31.4% |
| Standard Deviation (Sample) | 7.2% | 26.3% |
| Standard Deviation (Population) | 7.1% | 26.1% |
Similar Demographics by Unemployment Among Women with Children Under 6 years
Demographics Similar to Malaysians by Unemployment Among Women with Children Under 6 years
In terms of unemployment among women with children under 6 years, the demographic groups most similar to Malaysians are Immigrants from St. Vincent and the Grenadines (7.7%, a difference of 0.0%), Syrian (7.7%, a difference of 0.060%), Italian (7.7%, a difference of 0.060%), Lithuanian (7.8%, a difference of 0.090%), and Immigrants from Austria (7.7%, a difference of 0.10%).
| Demographics | Rating | Rank | Unemployment Among Women with Children Under 6 years |
| Czechoslovakians | 38.4 /100 | #188 | Fair 7.7% |
| Immigrants | Panama | 35.7 /100 | #189 | Fair 7.7% |
| Immigrants | North Macedonia | 34.4 /100 | #190 | Fair 7.7% |
| Immigrants | Austria | 32.4 /100 | #191 | Fair 7.7% |
| Immigrants | Africa | 32.4 /100 | #192 | Fair 7.7% |
| Slavs | 32.4 /100 | #193 | Fair 7.7% |
| Syrians | 31.9 /100 | #194 | Fair 7.7% |
| Malaysians | 31.1 /100 | #195 | Fair 7.7% |
| Immigrants | St. Vincent and the Grenadines | 31.1 /100 | #196 | Fair 7.7% |
| Italians | 30.4 /100 | #197 | Fair 7.7% |
| Lithuanians | 30.0 /100 | #198 | Fair 7.8% |
| Immigrants | Poland | 27.3 /100 | #199 | Fair 7.8% |
| Guamanians/Chamorros | 25.5 /100 | #200 | Fair 7.8% |
| Basques | 24.7 /100 | #201 | Fair 7.8% |
| Sudanese | 23.5 /100 | #202 | Fair 7.8% |
Demographics Similar to Czechs by Unemployment Among Women with Children Under 6 years
In terms of unemployment among women with children under 6 years, the demographic groups most similar to Czechs are Immigrants from Grenada (7.6%, a difference of 0.060%), Immigrants from Scotland (7.6%, a difference of 0.11%), Immigrants from Canada (7.6%, a difference of 0.12%), Immigrants from North America (7.6%, a difference of 0.14%), and Kenyan (7.6%, a difference of 0.19%).
| Demographics | Rating | Rank | Unemployment Among Women with Children Under 6 years |
| British | 66.3 /100 | #163 | Good 7.6% |
| Ugandans | 65.8 /100 | #164 | Good 7.6% |
| Immigrants | South America | 65.6 /100 | #165 | Good 7.6% |
| Belgians | 63.5 /100 | #166 | Good 7.6% |
| Kenyans | 62.5 /100 | #167 | Good 7.6% |
| Immigrants | Canada | 61.6 /100 | #168 | Good 7.6% |
| Immigrants | Scotland | 61.3 /100 | #169 | Good 7.6% |
| Czechs | 59.8 /100 | #170 | Average 7.6% |
| Immigrants | Grenada | 59.0 /100 | #171 | Average 7.6% |
| Immigrants | North America | 57.7 /100 | #172 | Average 7.6% |
| Cree | 51.6 /100 | #173 | Average 7.6% |
| Immigrants | Laos | 50.0 /100 | #174 | Average 7.6% |
| Panamanians | 49.6 /100 | #175 | Average 7.6% |
| Puget Sound Salish | 47.7 /100 | #176 | Average 7.7% |
| Austrians | 46.0 /100 | #177 | Average 7.7% |