Macedonian vs Nigerian Unemployment Among Seniors over 65 years
COMPARE
Macedonian
Nigerian
Unemployment Among Seniors over 65 years
Unemployment Among Seniors over 65 years Comparison
Macedonians
Nigerians
4.8%
UNEMPLOYMENT AMONG SENIORS OVER 65 YEARS
99.9/ 100
METRIC RATING
39th/ 347
METRIC RANK
5.3%
UNEMPLOYMENT AMONG SENIORS OVER 65 YEARS
0.9/ 100
METRIC RATING
243rd/ 347
METRIC RANK
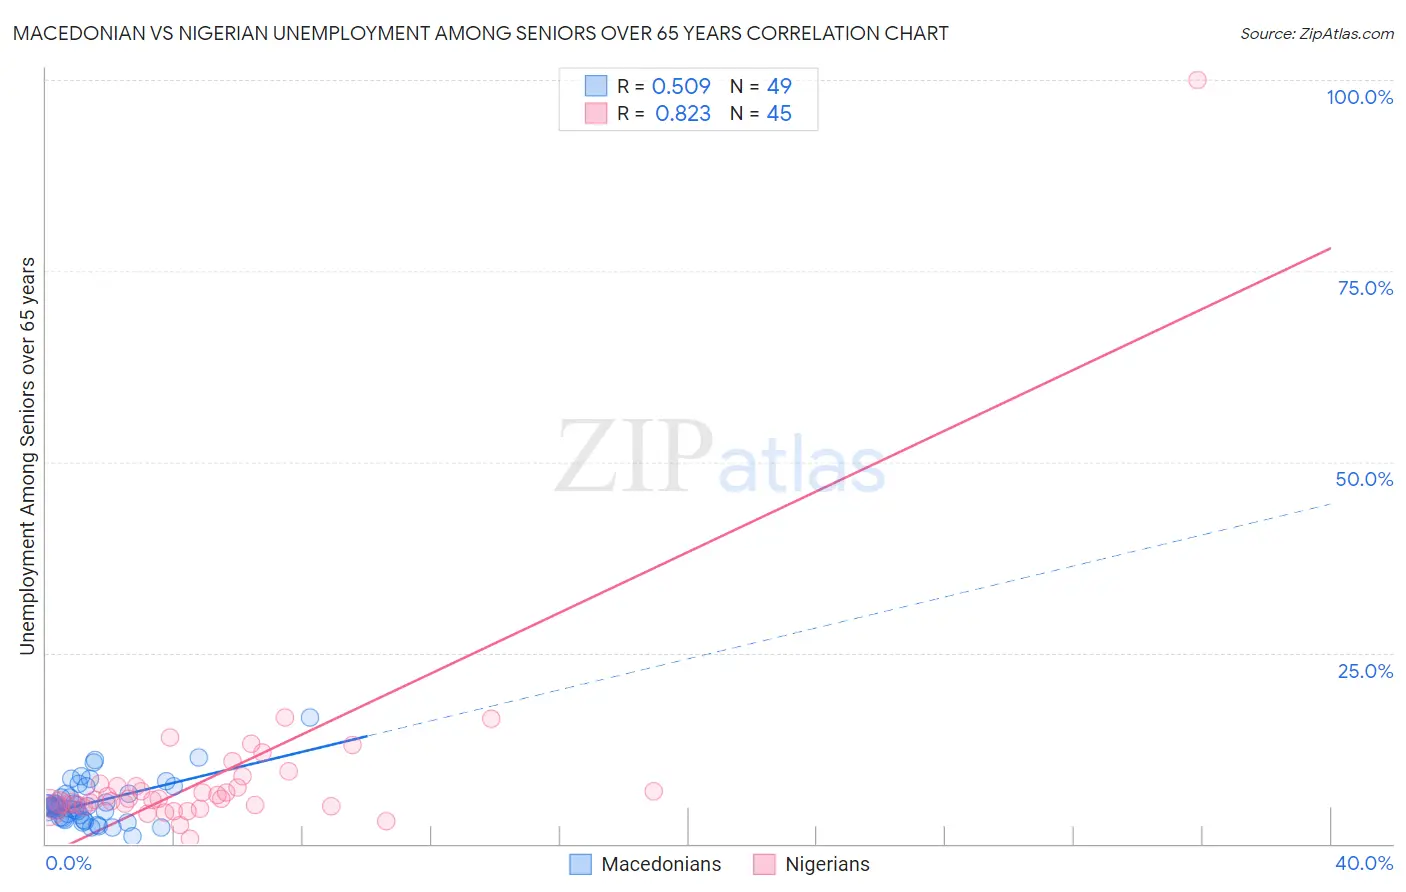
Macedonian vs Nigerian Unemployment Among Seniors over 65 years Correlation Chart
The statistical analysis conducted on geographies consisting of 125,744,138 people shows a substantial positive correlation between the proportion of Macedonians and unemployment rate amomg seniors over the age of 65 in the United States with a correlation coefficient (R) of 0.509 and weighted average of 4.8%. Similarly, the statistical analysis conducted on geographies consisting of 307,444,619 people shows a very strong positive correlation between the proportion of Nigerians and unemployment rate amomg seniors over the age of 65 in the United States with a correlation coefficient (R) of 0.823 and weighted average of 5.3%, a difference of 10.4%.
Unemployment Among Seniors over 65 years Correlation Summary
| Measurement | Macedonian | Nigerian |
| Minimum | 1.0% | 0.63% |
| Maximum | 16.6% | 100.0% |
| Range | 15.6% | 99.4% |
| Mean | 5.4% | 8.9% |
| Median | 4.8% | 5.9% |
| Interquartile 25% (IQ1) | 3.3% | 4.9% |
| Interquartile 75% (IQ3) | 6.5% | 7.7% |
| Interquartile Range (IQR) | 3.2% | 2.8% |
| Standard Deviation (Sample) | 2.9% | 14.3% |
| Standard Deviation (Population) | 2.9% | 14.1% |
Similar Demographics by Unemployment Among Seniors over 65 years
Demographics Similar to Macedonians by Unemployment Among Seniors over 65 years
In terms of unemployment among seniors over 65 years, the demographic groups most similar to Macedonians are Immigrants from India (4.8%, a difference of 0.030%), Bulgarian (4.8%, a difference of 0.090%), Cambodian (4.8%, a difference of 0.11%), Immigrants from Sweden (4.8%, a difference of 0.13%), and Kiowa (4.8%, a difference of 0.18%).
| Demographics | Rating | Rank | Unemployment Among Seniors over 65 years |
| Slovenes | 100.0 /100 | #32 | Exceptional 4.8% |
| Palestinians | 100.0 /100 | #33 | Exceptional 4.8% |
| Bhutanese | 100.0 /100 | #34 | Exceptional 4.8% |
| Immigrants | Kuwait | 100.0 /100 | #35 | Exceptional 4.8% |
| Cambodians | 100.0 /100 | #36 | Exceptional 4.8% |
| Bulgarians | 99.9 /100 | #37 | Exceptional 4.8% |
| Immigrants | India | 99.9 /100 | #38 | Exceptional 4.8% |
| Macedonians | 99.9 /100 | #39 | Exceptional 4.8% |
| Immigrants | Sweden | 99.9 /100 | #40 | Exceptional 4.8% |
| Kiowa | 99.9 /100 | #41 | Exceptional 4.8% |
| Swiss | 99.9 /100 | #42 | Exceptional 4.8% |
| Luxembourgers | 99.9 /100 | #43 | Exceptional 4.8% |
| Jordanians | 99.9 /100 | #44 | Exceptional 4.9% |
| Ethiopians | 99.9 /100 | #45 | Exceptional 4.9% |
| Immigrants | Jordan | 99.9 /100 | #46 | Exceptional 4.9% |
Demographics Similar to Nigerians by Unemployment Among Seniors over 65 years
In terms of unemployment among seniors over 65 years, the demographic groups most similar to Nigerians are Bahamian (5.3%, a difference of 0.030%), Peruvian (5.3%, a difference of 0.10%), Ottawa (5.3%, a difference of 0.11%), Colombian (5.3%, a difference of 0.14%), and Immigrants from Caribbean (5.3%, a difference of 0.17%).
| Demographics | Rating | Rank | Unemployment Among Seniors over 65 years |
| Immigrants | Costa Rica | 2.1 /100 | #236 | Tragic 5.3% |
| Immigrants | Greece | 2.0 /100 | #237 | Tragic 5.3% |
| Immigrants | Israel | 2.0 /100 | #238 | Tragic 5.3% |
| Immigrants | Senegal | 1.8 /100 | #239 | Tragic 5.3% |
| Immigrants | Trinidad and Tobago | 1.6 /100 | #240 | Tragic 5.3% |
| Apache | 1.3 /100 | #241 | Tragic 5.3% |
| Bahamians | 0.9 /100 | #242 | Tragic 5.3% |
| Nigerians | 0.9 /100 | #243 | Tragic 5.3% |
| Peruvians | 0.8 /100 | #244 | Tragic 5.3% |
| Ottawa | 0.8 /100 | #245 | Tragic 5.3% |
| Colombians | 0.7 /100 | #246 | Tragic 5.3% |
| Immigrants | Caribbean | 0.7 /100 | #247 | Tragic 5.3% |
| French Canadians | 0.7 /100 | #248 | Tragic 5.4% |
| Immigrants | Immigrants | 0.6 /100 | #249 | Tragic 5.4% |
| Ghanaians | 0.6 /100 | #250 | Tragic 5.4% |