Luxembourger vs Iranian Unemployment Among Ages 45 to 54 years
COMPARE
Luxembourger
Iranian
Unemployment Among Ages 45 to 54 years
Unemployment Among Ages 45 to 54 years Comparison
Luxembourgers
Iranians
4.2%
UNEMPLOYMENT AMONG AGES 45 TO 54 YEARS
99.6/ 100
METRIC RATING
46th/ 347
METRIC RANK
4.4%
UNEMPLOYMENT AMONG AGES 45 TO 54 YEARS
92.5/ 100
METRIC RATING
106th/ 347
METRIC RANK
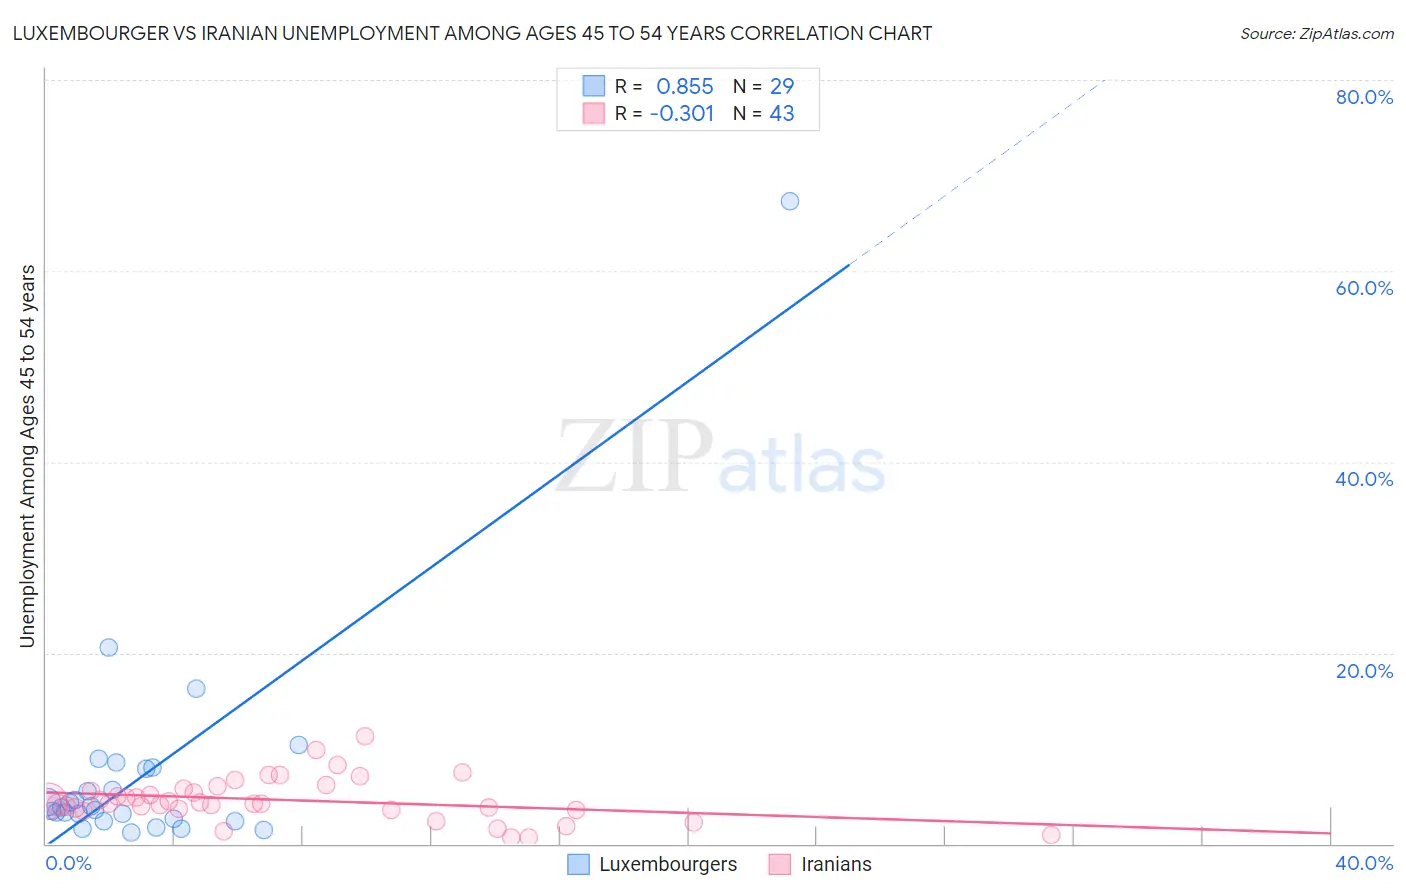
Luxembourger vs Iranian Unemployment Among Ages 45 to 54 years Correlation Chart
The statistical analysis conducted on geographies consisting of 141,471,096 people shows a very strong positive correlation between the proportion of Luxembourgers and unemployment rate among population between the ages 45 and 54 in the United States with a correlation coefficient (R) of 0.855 and weighted average of 4.2%. Similarly, the statistical analysis conducted on geographies consisting of 311,597,044 people shows a mild negative correlation between the proportion of Iranians and unemployment rate among population between the ages 45 and 54 in the United States with a correlation coefficient (R) of -0.301 and weighted average of 4.4%, a difference of 3.9%.
Unemployment Among Ages 45 to 54 years Correlation Summary
| Measurement | Luxembourger | Iranian |
| Minimum | 1.2% | 0.60% |
| Maximum | 67.3% | 11.3% |
| Range | 66.1% | 10.7% |
| Mean | 7.4% | 4.6% |
| Median | 3.8% | 4.3% |
| Interquartile 25% (IQ1) | 2.5% | 3.6% |
| Interquartile 75% (IQ3) | 8.0% | 5.8% |
| Interquartile Range (IQR) | 5.5% | 2.2% |
| Standard Deviation (Sample) | 12.3% | 2.3% |
| Standard Deviation (Population) | 12.1% | 2.2% |
Similar Demographics by Unemployment Among Ages 45 to 54 years
Demographics Similar to Luxembourgers by Unemployment Among Ages 45 to 54 years
In terms of unemployment among ages 45 to 54 years, the demographic groups most similar to Luxembourgers are Filipino (4.2%, a difference of 0.010%), Finnish (4.2%, a difference of 0.080%), Immigrants from Bulgaria (4.2%, a difference of 0.090%), Immigrants from Zimbabwe (4.2%, a difference of 0.12%), and Basque (4.2%, a difference of 0.13%).
| Demographics | Rating | Rank | Unemployment Among Ages 45 to 54 years |
| Jordanians | 99.8 /100 | #39 | Exceptional 4.2% |
| Northern Europeans | 99.8 /100 | #40 | Exceptional 4.2% |
| Czechoslovakians | 99.8 /100 | #41 | Exceptional 4.2% |
| Immigrants | Scotland | 99.8 /100 | #42 | Exceptional 4.2% |
| Zimbabweans | 99.8 /100 | #43 | Exceptional 4.2% |
| Immigrants | Singapore | 99.7 /100 | #44 | Exceptional 4.2% |
| Immigrants | Bulgaria | 99.7 /100 | #45 | Exceptional 4.2% |
| Luxembourgers | 99.6 /100 | #46 | Exceptional 4.2% |
| Filipinos | 99.6 /100 | #47 | Exceptional 4.2% |
| Finns | 99.6 /100 | #48 | Exceptional 4.2% |
| Immigrants | Zimbabwe | 99.6 /100 | #49 | Exceptional 4.2% |
| Basques | 99.6 /100 | #50 | Exceptional 4.2% |
| Burmese | 99.6 /100 | #51 | Exceptional 4.2% |
| Poles | 99.5 /100 | #52 | Exceptional 4.2% |
| Irish | 99.5 /100 | #53 | Exceptional 4.2% |
Demographics Similar to Iranians by Unemployment Among Ages 45 to 54 years
In terms of unemployment among ages 45 to 54 years, the demographic groups most similar to Iranians are Immigrants from South Africa (4.4%, a difference of 0.0%), Immigrants from Kenya (4.4%, a difference of 0.060%), Russian (4.4%, a difference of 0.060%), Immigrants from Sweden (4.4%, a difference of 0.090%), and New Zealander (4.4%, a difference of 0.090%).
| Demographics | Rating | Rank | Unemployment Among Ages 45 to 54 years |
| Immigrants | Burma/Myanmar | 94.9 /100 | #99 | Exceptional 4.4% |
| Immigrants | Eritrea | 94.7 /100 | #100 | Exceptional 4.4% |
| Immigrants | North America | 93.9 /100 | #101 | Exceptional 4.4% |
| Sri Lankans | 93.7 /100 | #102 | Exceptional 4.4% |
| Icelanders | 93.5 /100 | #103 | Exceptional 4.4% |
| Immigrants | Sweden | 93.0 /100 | #104 | Exceptional 4.4% |
| Immigrants | Kenya | 92.8 /100 | #105 | Exceptional 4.4% |
| Iranians | 92.5 /100 | #106 | Exceptional 4.4% |
| Immigrants | South Africa | 92.5 /100 | #107 | Exceptional 4.4% |
| Russians | 92.1 /100 | #108 | Exceptional 4.4% |
| New Zealanders | 91.9 /100 | #109 | Exceptional 4.4% |
| Immigrants | England | 91.3 /100 | #110 | Exceptional 4.4% |
| Immigrants | Nicaragua | 91.3 /100 | #111 | Exceptional 4.4% |
| Immigrants | Saudi Arabia | 91.1 /100 | #112 | Exceptional 4.4% |
| French Canadians | 91.0 /100 | #113 | Exceptional 4.4% |