Luxembourger vs Immigrants from Jamaica Unemployment Among Seniors over 75 years
COMPARE
Luxembourger
Immigrants from Jamaica
Unemployment Among Seniors over 75 years
Unemployment Among Seniors over 75 years Comparison
Luxembourgers
Immigrants from Jamaica
7.7%
UNEMPLOYMENT AMONG SENIORS OVER 75 YEARS
100.0/ 100
METRIC RATING
36th/ 347
METRIC RANK
8.9%
UNEMPLOYMENT AMONG SENIORS OVER 75 YEARS
27.7/ 100
METRIC RATING
196th/ 347
METRIC RANK
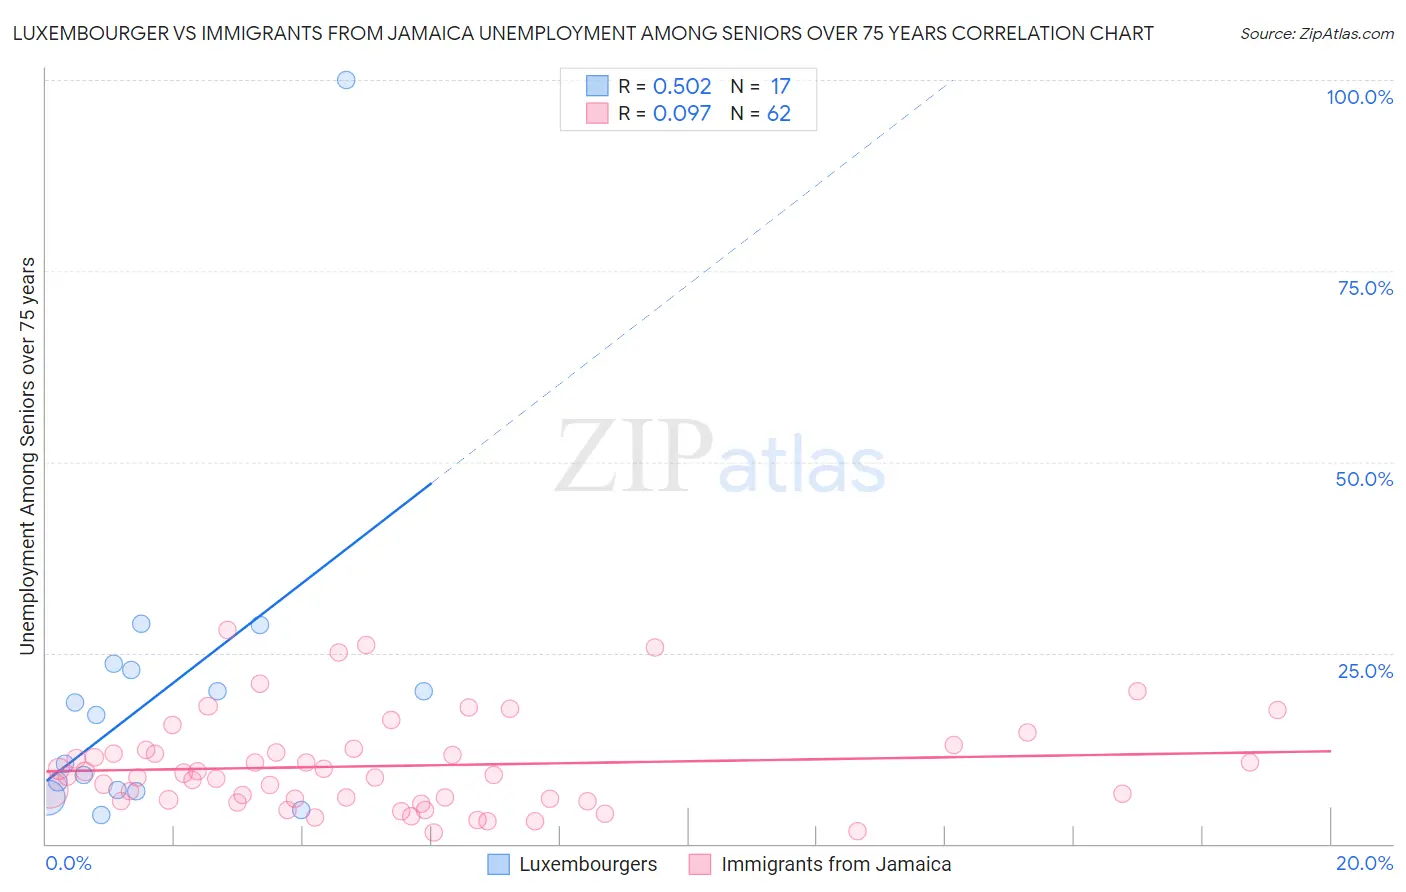
Luxembourger vs Immigrants from Jamaica Unemployment Among Seniors over 75 years Correlation Chart
The statistical analysis conducted on geographies consisting of 97,757,324 people shows a substantial positive correlation between the proportion of Luxembourgers and unemployment rate among seniors over the age of 75 in the United States with a correlation coefficient (R) of 0.502 and weighted average of 7.7%. Similarly, the statistical analysis conducted on geographies consisting of 168,253,642 people shows a slight positive correlation between the proportion of Immigrants from Jamaica and unemployment rate among seniors over the age of 75 in the United States with a correlation coefficient (R) of 0.097 and weighted average of 8.9%, a difference of 15.2%.
Unemployment Among Seniors over 75 years Correlation Summary
| Measurement | Luxembourger | Immigrants from Jamaica |
| Minimum | 3.8% | 1.4% |
| Maximum | 100.0% | 28.0% |
| Range | 96.2% | 26.6% |
| Mean | 19.7% | 10.2% |
| Median | 16.8% | 8.9% |
| Interquartile 25% (IQ1) | 7.0% | 5.7% |
| Interquartile 75% (IQ3) | 23.1% | 12.3% |
| Interquartile Range (IQR) | 16.2% | 6.6% |
| Standard Deviation (Sample) | 22.3% | 6.2% |
| Standard Deviation (Population) | 21.7% | 6.2% |
Similar Demographics by Unemployment Among Seniors over 75 years
Demographics Similar to Luxembourgers by Unemployment Among Seniors over 75 years
In terms of unemployment among seniors over 75 years, the demographic groups most similar to Luxembourgers are Immigrants from Norway (7.7%, a difference of 0.10%), Immigrants from Hungary (7.7%, a difference of 0.20%), Kiowa (7.7%, a difference of 0.22%), Ugandan (7.7%, a difference of 0.25%), and Colville (7.7%, a difference of 0.28%).
| Demographics | Rating | Rank | Unemployment Among Seniors over 75 years |
| Immigrants | Iran | 100.0 /100 | #29 | Exceptional 7.6% |
| Immigrants | Sweden | 100.0 /100 | #30 | Exceptional 7.6% |
| Guyanese | 100.0 /100 | #31 | Exceptional 7.6% |
| Immigrants | Hong Kong | 100.0 /100 | #32 | Exceptional 7.6% |
| Cambodians | 100.0 /100 | #33 | Exceptional 7.6% |
| Immigrants | Eritrea | 100.0 /100 | #34 | Exceptional 7.7% |
| Immigrants | Norway | 100.0 /100 | #35 | Exceptional 7.7% |
| Luxembourgers | 100.0 /100 | #36 | Exceptional 7.7% |
| Immigrants | Hungary | 100.0 /100 | #37 | Exceptional 7.7% |
| Kiowa | 100.0 /100 | #38 | Exceptional 7.7% |
| Ugandans | 100.0 /100 | #39 | Exceptional 7.7% |
| Colville | 100.0 /100 | #40 | Exceptional 7.7% |
| Immigrants | Burma/Myanmar | 100.0 /100 | #41 | Exceptional 7.7% |
| Pueblo | 100.0 /100 | #42 | Exceptional 7.7% |
| Immigrants | Denmark | 100.0 /100 | #43 | Exceptional 7.8% |
Demographics Similar to Immigrants from Jamaica by Unemployment Among Seniors over 75 years
In terms of unemployment among seniors over 75 years, the demographic groups most similar to Immigrants from Jamaica are Okinawan (8.8%, a difference of 0.070%), Maltese (8.8%, a difference of 0.090%), Immigrants from Laos (8.9%, a difference of 0.10%), Eastern European (8.9%, a difference of 0.12%), and Immigrants from Guyana (8.8%, a difference of 0.14%).
| Demographics | Rating | Rank | Unemployment Among Seniors over 75 years |
| Immigrants | Haiti | 34.7 /100 | #189 | Fair 8.8% |
| Mexican American Indians | 34.7 /100 | #190 | Fair 8.8% |
| Estonians | 33.3 /100 | #191 | Fair 8.8% |
| Immigrants | Kenya | 31.8 /100 | #192 | Fair 8.8% |
| Immigrants | Guyana | 29.9 /100 | #193 | Fair 8.8% |
| Maltese | 29.2 /100 | #194 | Fair 8.8% |
| Okinawans | 28.9 /100 | #195 | Fair 8.8% |
| Immigrants | Jamaica | 27.7 /100 | #196 | Fair 8.9% |
| Immigrants | Laos | 26.3 /100 | #197 | Fair 8.9% |
| Eastern Europeans | 25.9 /100 | #198 | Fair 8.9% |
| Pakistanis | 25.4 /100 | #199 | Fair 8.9% |
| Osage | 25.4 /100 | #200 | Fair 8.9% |
| Immigrants | Peru | 24.3 /100 | #201 | Fair 8.9% |
| Russians | 24.1 /100 | #202 | Fair 8.9% |
| Immigrants | Northern Europe | 23.9 /100 | #203 | Fair 8.9% |