Lumbee vs Latvian Unemployment Among Women with Children Under 6 years
COMPARE
Lumbee
Latvian
Unemployment Among Women with Children Under 6 years
Unemployment Among Women with Children Under 6 years Comparison
Lumbee
Latvians
13.8%
UNEMPLOYMENT AMONG WOMEN WITH CHILDREN UNDER 6 YEARS
0.0/ 100
METRIC RATING
341st/ 347
METRIC RANK
6.8%
UNEMPLOYMENT AMONG WOMEN WITH CHILDREN UNDER 6 YEARS
99.9/ 100
METRIC RATING
46th/ 347
METRIC RANK
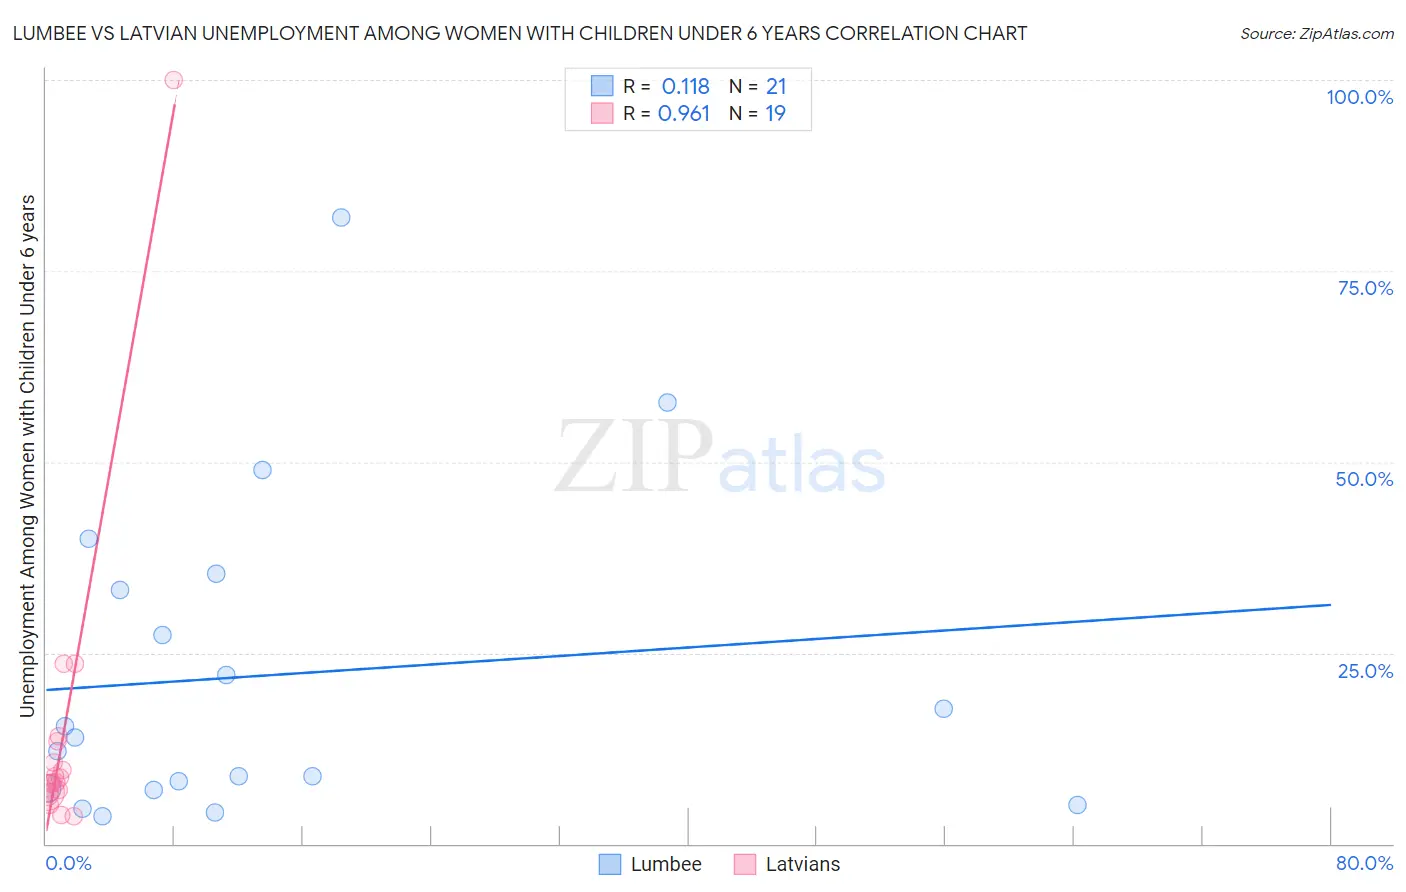
Lumbee vs Latvian Unemployment Among Women with Children Under 6 years Correlation Chart
The statistical analysis conducted on geographies consisting of 81,574,095 people shows a poor positive correlation between the proportion of Lumbee and unemployment rate among women with children under the age of 6 in the United States with a correlation coefficient (R) of 0.118 and weighted average of 13.8%. Similarly, the statistical analysis conducted on geographies consisting of 177,379,958 people shows a perfect positive correlation between the proportion of Latvians and unemployment rate among women with children under the age of 6 in the United States with a correlation coefficient (R) of 0.961 and weighted average of 6.8%, a difference of 103.8%.
Unemployment Among Women with Children Under 6 years Correlation Summary
| Measurement | Lumbee | Latvian |
| Minimum | 3.6% | 3.6% |
| Maximum | 82.0% | 100.0% |
| Range | 78.4% | 96.4% |
| Mean | 22.1% | 14.5% |
| Median | 14.0% | 8.0% |
| Interquartile 25% (IQ1) | 7.2% | 6.7% |
| Interquartile 75% (IQ3) | 34.3% | 13.4% |
| Interquartile Range (IQR) | 27.1% | 6.7% |
| Standard Deviation (Sample) | 20.9% | 21.4% |
| Standard Deviation (Population) | 20.4% | 20.9% |
Similar Demographics by Unemployment Among Women with Children Under 6 years
Demographics Similar to Lumbee by Unemployment Among Women with Children Under 6 years
In terms of unemployment among women with children under 6 years, the demographic groups most similar to Lumbee are Navajo (13.5%, a difference of 2.2%), Immigrants from Yemen (13.5%, a difference of 2.2%), Pima (13.4%, a difference of 2.6%), Chippewa (13.3%, a difference of 3.4%), and Shoshone (13.2%, a difference of 4.6%).
| Demographics | Rating | Rank | Unemployment Among Women with Children Under 6 years |
| Natives/Alaskans | 0.0 /100 | #333 | Tragic 11.5% |
| Apache | 0.0 /100 | #334 | Tragic 12.3% |
| Puerto Ricans | 0.0 /100 | #335 | Tragic 12.5% |
| Shoshone | 0.0 /100 | #336 | Tragic 13.2% |
| Chippewa | 0.0 /100 | #337 | Tragic 13.3% |
| Pima | 0.0 /100 | #338 | Tragic 13.4% |
| Navajo | 0.0 /100 | #339 | Tragic 13.5% |
| Immigrants | Yemen | 0.0 /100 | #340 | Tragic 13.5% |
| Lumbee | 0.0 /100 | #341 | Tragic 13.8% |
| Yuman | 0.0 /100 | #342 | Tragic 14.6% |
| Crow | 0.0 /100 | #343 | Tragic 14.6% |
| Hopi | 0.0 /100 | #344 | Tragic 16.8% |
| Inupiat | 0.0 /100 | #345 | Tragic 17.7% |
| Arapaho | 0.0 /100 | #346 | Tragic 19.0% |
| Yup'ik | 0.0 /100 | #347 | Tragic 21.1% |
Demographics Similar to Latvians by Unemployment Among Women with Children Under 6 years
In terms of unemployment among women with children under 6 years, the demographic groups most similar to Latvians are Immigrants from Asia (6.8%, a difference of 0.17%), Immigrants from Switzerland (6.8%, a difference of 0.20%), Immigrants from Australia (6.8%, a difference of 0.24%), Immigrants from Nepal (6.8%, a difference of 0.26%), and Immigrants from Ireland (6.8%, a difference of 0.26%).
| Demographics | Rating | Rank | Unemployment Among Women with Children Under 6 years |
| Immigrants | Russia | 100.0 /100 | #39 | Exceptional 6.7% |
| Asians | 100.0 /100 | #40 | Exceptional 6.7% |
| Immigrants | Indonesia | 99.9 /100 | #41 | Exceptional 6.7% |
| Immigrants | Cuba | 99.9 /100 | #42 | Exceptional 6.7% |
| Bhutanese | 99.9 /100 | #43 | Exceptional 6.7% |
| Iranians | 99.9 /100 | #44 | Exceptional 6.7% |
| Immigrants | Australia | 99.9 /100 | #45 | Exceptional 6.8% |
| Latvians | 99.9 /100 | #46 | Exceptional 6.8% |
| Immigrants | Asia | 99.9 /100 | #47 | Exceptional 6.8% |
| Immigrants | Switzerland | 99.9 /100 | #48 | Exceptional 6.8% |
| Immigrants | Nepal | 99.9 /100 | #49 | Exceptional 6.8% |
| Immigrants | Ireland | 99.9 /100 | #50 | Exceptional 6.8% |
| Ethiopians | 99.9 /100 | #51 | Exceptional 6.8% |
| Immigrants | Iran | 99.9 /100 | #52 | Exceptional 6.8% |
| Chinese | 99.9 /100 | #53 | Exceptional 6.8% |