Lumbee vs Immigrants from Sweden Female Unemployment
COMPARE
Lumbee
Immigrants from Sweden
Female Unemployment
Female Unemployment Comparison
Lumbee
Immigrants from Sweden
5.9%
FEMALE UNEMPLOYMENT
0.0/ 100
METRIC RATING
272nd/ 347
METRIC RANK
5.0%
FEMALE UNEMPLOYMENT
96.3/ 100
METRIC RATING
90th/ 347
METRIC RANK
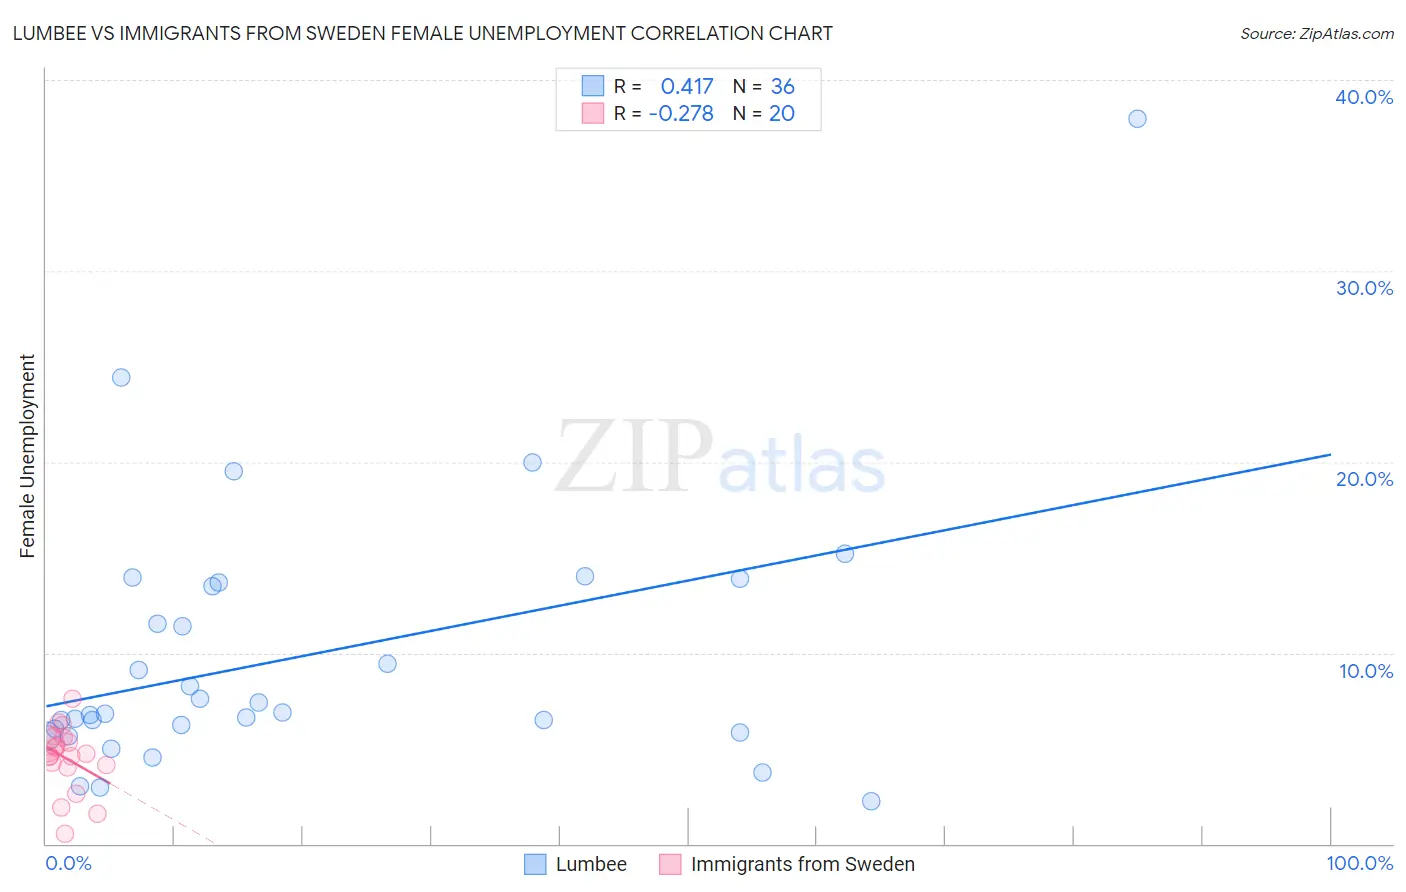
Lumbee vs Immigrants from Sweden Female Unemployment Correlation Chart
The statistical analysis conducted on geographies consisting of 92,134,947 people shows a moderate positive correlation between the proportion of Lumbee and unemploymnet rate among females in the United States with a correlation coefficient (R) of 0.417 and weighted average of 5.9%. Similarly, the statistical analysis conducted on geographies consisting of 164,471,082 people shows a weak negative correlation between the proportion of Immigrants from Sweden and unemploymnet rate among females in the United States with a correlation coefficient (R) of -0.278 and weighted average of 5.0%, a difference of 18.9%.
Female Unemployment Correlation Summary
| Measurement | Lumbee | Immigrants from Sweden |
| Minimum | 2.2% | 0.50% |
| Maximum | 38.0% | 7.6% |
| Range | 35.8% | 7.1% |
| Mean | 9.8% | 4.5% |
| Median | 6.9% | 4.7% |
| Interquartile 25% (IQ1) | 5.9% | 4.1% |
| Interquartile 75% (IQ3) | 13.6% | 5.4% |
| Interquartile Range (IQR) | 7.7% | 1.4% |
| Standard Deviation (Sample) | 7.0% | 1.7% |
| Standard Deviation (Population) | 6.9% | 1.7% |
Similar Demographics by Female Unemployment
Demographics Similar to Lumbee by Female Unemployment
In terms of female unemployment, the demographic groups most similar to Lumbee are Ghanaian (5.9%, a difference of 0.010%), African (5.9%, a difference of 0.090%), Central American (5.9%, a difference of 0.19%), Immigrants from Honduras (5.9%, a difference of 0.29%), and Senegalese (6.0%, a difference of 0.58%).
| Demographics | Rating | Rank | Female Unemployment |
| Blackfeet | 0.0 /100 | #265 | Tragic 5.9% |
| Cape Verdeans | 0.0 /100 | #266 | Tragic 5.9% |
| Nepalese | 0.0 /100 | #267 | Tragic 5.9% |
| Hondurans | 0.0 /100 | #268 | Tragic 5.9% |
| Immigrants | Western Africa | 0.0 /100 | #269 | Tragic 5.9% |
| Immigrants | Honduras | 0.0 /100 | #270 | Tragic 5.9% |
| Central Americans | 0.0 /100 | #271 | Tragic 5.9% |
| Lumbee | 0.0 /100 | #272 | Tragic 5.9% |
| Ghanaians | 0.0 /100 | #273 | Tragic 5.9% |
| Africans | 0.0 /100 | #274 | Tragic 5.9% |
| Senegalese | 0.0 /100 | #275 | Tragic 6.0% |
| Bahamians | 0.0 /100 | #276 | Tragic 6.0% |
| Immigrants | Ghana | 0.0 /100 | #277 | Tragic 6.0% |
| Yaqui | 0.0 /100 | #278 | Tragic 6.0% |
| Armenians | 0.0 /100 | #279 | Tragic 6.0% |
Demographics Similar to Immigrants from Sweden by Female Unemployment
In terms of female unemployment, the demographic groups most similar to Immigrants from Sweden are Immigrants from Japan (5.0%, a difference of 0.12%), Romanian (5.0%, a difference of 0.14%), Immigrants from Taiwan (5.0%, a difference of 0.17%), Immigrants from Sudan (5.0%, a difference of 0.22%), and Immigrants from Austria (5.0%, a difference of 0.22%).
| Demographics | Rating | Rank | Female Unemployment |
| Immigrants | Serbia | 97.2 /100 | #83 | Exceptional 5.0% |
| Canadians | 97.2 /100 | #84 | Exceptional 5.0% |
| Ukrainians | 97.1 /100 | #85 | Exceptional 5.0% |
| Bolivians | 97.1 /100 | #86 | Exceptional 5.0% |
| Venezuelans | 96.9 /100 | #87 | Exceptional 5.0% |
| Immigrants | Sudan | 96.7 /100 | #88 | Exceptional 5.0% |
| Immigrants | Taiwan | 96.6 /100 | #89 | Exceptional 5.0% |
| Immigrants | Sweden | 96.3 /100 | #90 | Exceptional 5.0% |
| Immigrants | Japan | 96.0 /100 | #91 | Exceptional 5.0% |
| Romanians | 95.9 /100 | #92 | Exceptional 5.0% |
| Immigrants | Austria | 95.7 /100 | #93 | Exceptional 5.0% |
| Immigrants | Malaysia | 95.7 /100 | #94 | Exceptional 5.0% |
| Burmese | 95.6 /100 | #95 | Exceptional 5.0% |
| Immigrants | South Central Asia | 95.5 /100 | #96 | Exceptional 5.0% |
| Immigrants | Somalia | 95.2 /100 | #97 | Exceptional 5.0% |