Lumbee vs Austrian Unemployment Among Women with Children Under 18 years

COMPARE

Lumbee
Race
Ancestry
AfghanAfricanAlaska NativeAlaskan AthabascanAlbanianAleutAlsatianAmericanApacheArabArapahoArgentineanArmenianAssyrian/Chaldean/SyriacAustralianBahamianBangladeshiBarbadianBasqueBelgianBelizeanBermudanBhutaneseBlackfeetBolivianBrazilianBritishBritish West IndianBulgarianBurmeseCajunCambodianCanadianCape VerdeanCarpatho RusynCelticCentral AmericanCentral American IndianCherokeeCheyenneChickasawChileanChineseChippewaChoctawColombianColvilleComancheCosta RicanCreeCreekCroatianCrowCubanCypriotCzechCzechoslovakianDanishDelawareDominicanDutchDutch West IndianEastern EuropeanEcuadorianEgyptianEnglishEstonianEthiopianEuropeanFijianFilipinoFinnishFrenchFrench American IndianFrench CanadianGermanGerman RussianGhanaianGreekGuamanian/ChamorroGuatemalanGuyaneseHaitianHmongHonduranHopiHoumaHungarianIcelanderIndian (Asian)IndonesianInupiatIranianIraqiIrishIroquoisIsraeliItalianJamaicanJapaneseJordanianKenyanKiowaKoreanLaotianLatvianLebaneseLiberianLithuanianLumbeeLuxembourgerMacedonianMalaysianMalteseMarshalleseMenomineeMexicanMexican American IndianMongolianMoroccanNative HawaiianNavajoNepaleseNew ZealanderNicaraguanNigerianNorthern EuropeanNorwegianOkinawanOsageOttawaPaiutePakistaniPalestinianPanamanianParaguayanPennsylvania GermanPeruvianPimaPolishPortuguesePotawatomiPuebloPuerto RicanPuget Sound SalishRomanianRussianSalvadoranSamoanScandinavianScotch-IrishScottishSeminoleSenegaleseSerbianShoshoneSierra LeoneanSiouxSlavicSlovakSloveneSomaliSouth AfricanSouth AmericanSouth American IndianSoviet UnionSpaniardSpanishSpanish AmericanSpanish American IndianSri LankanSubsaharan AfricanSudaneseSwedishSwissSyrianTaiwaneseThaiTlingit-HaidaTohono O'OdhamTonganTrinidadian and TobagonianTsimshianTurkishU.S. Virgin IslanderUgandanUkrainianUruguayanUteVenezuelanVietnameseWelshWest IndianYakamaYaquiYugoslavianYumanYup'ikZimbabwean
Immigration
NonimmigrantsImmigrantsAfghanistanAfricaAlbaniaArgentinaArmeniaAsiaAustraliaAustriaBahamasBangladeshBarbadosBelarusBelgiumBelizeBoliviaBosnia and HerzegovinaBrazilBulgariaBurma/MyanmarCabo VerdeCambodiaCameroonCanadaCaribbeanCentral AmericaChileChinaColombiaCongoCosta RicaCroatiaCubaCzechoslovakiaDenmarkDominicaDominican RepublicEastern AfricaEastern AsiaEastern EuropeEcuadorEgyptEl SalvadorEnglandEritreaEthiopiaEuropeFijiFranceGermanyGhanaGreeceGrenadaGuatemalaGuyanaHaitiHondurasHong KongHungaryIndiaIndonesiaIranIraqIrelandIsraelItalyJamaicaJapanJordanKazakhstanKenyaKoreaKuwaitLaosLatin AmericaLatviaLebanonLiberiaLithuaniaMalaysiaMexicoMicronesiaMiddle AfricaMoldovaMoroccoNepalNetherlandsNicaraguaNigeriaNorth AmericaNorth MacedoniaNorthern AfricaNorthern EuropeNorwayOceaniaPakistanPanamaPeruPhilippinesPolandPortugalRomaniaRussiaSaudi ArabiaScotlandSenegalSerbiaSierra LeoneSingaporeSomaliaSouth AfricaSouth AmericaSouth Central AsiaSouth Eastern AsiaSouthern EuropeSpainSri LankaSt. Vincent and the GrenadinesSudanSwedenSwitzerlandSyriaTaiwanThailandTrinidad and TobagoTurkeyUgandaUkraineUruguayUzbekistanVenezuelaVietnamWest IndiesWestern AfricaWestern AsiaWestern EuropeYemenZaireZimbabweAzores
Austrian
Race
Ancestry
AfghanAfricanAlaska NativeAlaskan AthabascanAlbanianAleutAlsatianAmericanApacheArabArapahoArgentineanArmenianAssyrian/Chaldean/SyriacAustralianAustrianBahamianBangladeshiBarbadianBasqueBelgianBelizeanBermudanBhutaneseBlackfeetBolivianBrazilianBritishBritish West IndianBulgarianBurmeseCajunCambodianCanadianCape VerdeanCarpatho RusynCelticCentral AmericanCentral American IndianCherokeeCheyenneChickasawChileanChineseChippewaChoctawColombianColvilleComancheCosta RicanCreeCreekCroatianCrowCubanCypriotCzechCzechoslovakianDanishDelawareDominicanDutchDutch West IndianEastern EuropeanEcuadorianEgyptianEnglishEstonianEthiopianEuropeanFijianFilipinoFinnishFrenchFrench American IndianFrench CanadianGermanGerman RussianGhanaianGreekGuamanian/ChamorroGuatemalanGuyaneseHaitianHmongHonduranHopiHoumaHungarianIcelanderIndian (Asian)IndonesianInupiatIranianIraqiIrishIroquoisIsraeliItalianJamaicanJapaneseJordanianKenyanKiowaKoreanLaotianLatvianLebaneseLiberianLithuanianLuxembourgerMacedonianMalaysianMalteseMarshalleseMenomineeMexicanMexican American IndianMongolianMoroccanNative HawaiianNavajoNepaleseNew ZealanderNicaraguanNigerianNorthern EuropeanNorwegianOkinawanOsageOttawaPaiutePakistaniPalestinianPanamanianParaguayanPennsylvania GermanPeruvianPimaPolishPortuguesePotawatomiPuebloPuerto RicanPuget Sound SalishRomanianRussianSalvadoranSamoanScandinavianScotch-IrishScottishSeminoleSenegaleseSerbianShoshoneSierra LeoneanSiouxSlavicSlovakSloveneSomaliSouth AfricanSouth AmericanSouth American IndianSoviet UnionSpaniardSpanishSpanish AmericanSpanish American IndianSri LankanSubsaharan AfricanSudaneseSwedishSwissSyrianTaiwaneseThaiTlingit-HaidaTohono O'OdhamTonganTrinidadian and TobagonianTsimshianTurkishU.S. Virgin IslanderUgandanUkrainianUruguayanUteVenezuelanVietnameseWelshWest IndianYakamaYaquiYugoslavianYumanYup'ikZimbabwean
Immigration
NonimmigrantsImmigrantsAfghanistanAfricaAlbaniaArgentinaArmeniaAsiaAustraliaAustriaBahamasBangladeshBarbadosBelarusBelgiumBelizeBoliviaBosnia and HerzegovinaBrazilBulgariaBurma/MyanmarCabo VerdeCambodiaCameroonCanadaCaribbeanCentral AmericaChileChinaColombiaCongoCosta RicaCroatiaCubaCzechoslovakiaDenmarkDominicaDominican RepublicEastern AfricaEastern AsiaEastern EuropeEcuadorEgyptEl SalvadorEnglandEritreaEthiopiaEuropeFijiFranceGermanyGhanaGreeceGrenadaGuatemalaGuyanaHaitiHondurasHong KongHungaryIndiaIndonesiaIranIraqIrelandIsraelItalyJamaicaJapanJordanKazakhstanKenyaKoreaKuwaitLaosLatin AmericaLatviaLebanonLiberiaLithuaniaMalaysiaMexicoMicronesiaMiddle AfricaMoldovaMoroccoNepalNetherlandsNicaraguaNigeriaNorth AmericaNorth MacedoniaNorthern AfricaNorthern EuropeNorwayOceaniaPakistanPanamaPeruPhilippinesPolandPortugalRomaniaRussiaSaudi ArabiaScotlandSenegalSerbiaSierra LeoneSingaporeSomaliaSouth AfricaSouth AmericaSouth Central AsiaSouth Eastern AsiaSouthern EuropeSpainSri LankaSt. Vincent and the GrenadinesSudanSwedenSwitzerlandSyriaTaiwanThailandTrinidad and TobagoTurkeyUgandaUkraineUruguayUzbekistanVenezuelaVietnamWest IndiesWestern AfricaWestern AsiaWestern EuropeYemenZaireZimbabweAzores
Unemployment Among Women with Children Under 18 years
Income
Poverty
Unemployment
Labor Participation
Family Structure
Vehicle Availability
Education Level
Disability

Unemployment Among Women with Children Under 18 years Comparison

Lumbee

Austrians

Tragic
Exceptional
7.1%
UNEMPLOYMENT AMONG WOMEN WITH CHILDREN UNDER 18 YEARS
0.0/ 100
METRIC RATING
327th/ 347
METRIC RANK
5.1%
UNEMPLOYMENT AMONG WOMEN WITH CHILDREN UNDER 18 YEARS
96.6/ 100
METRIC RATING
69th/ 347
METRIC RANK

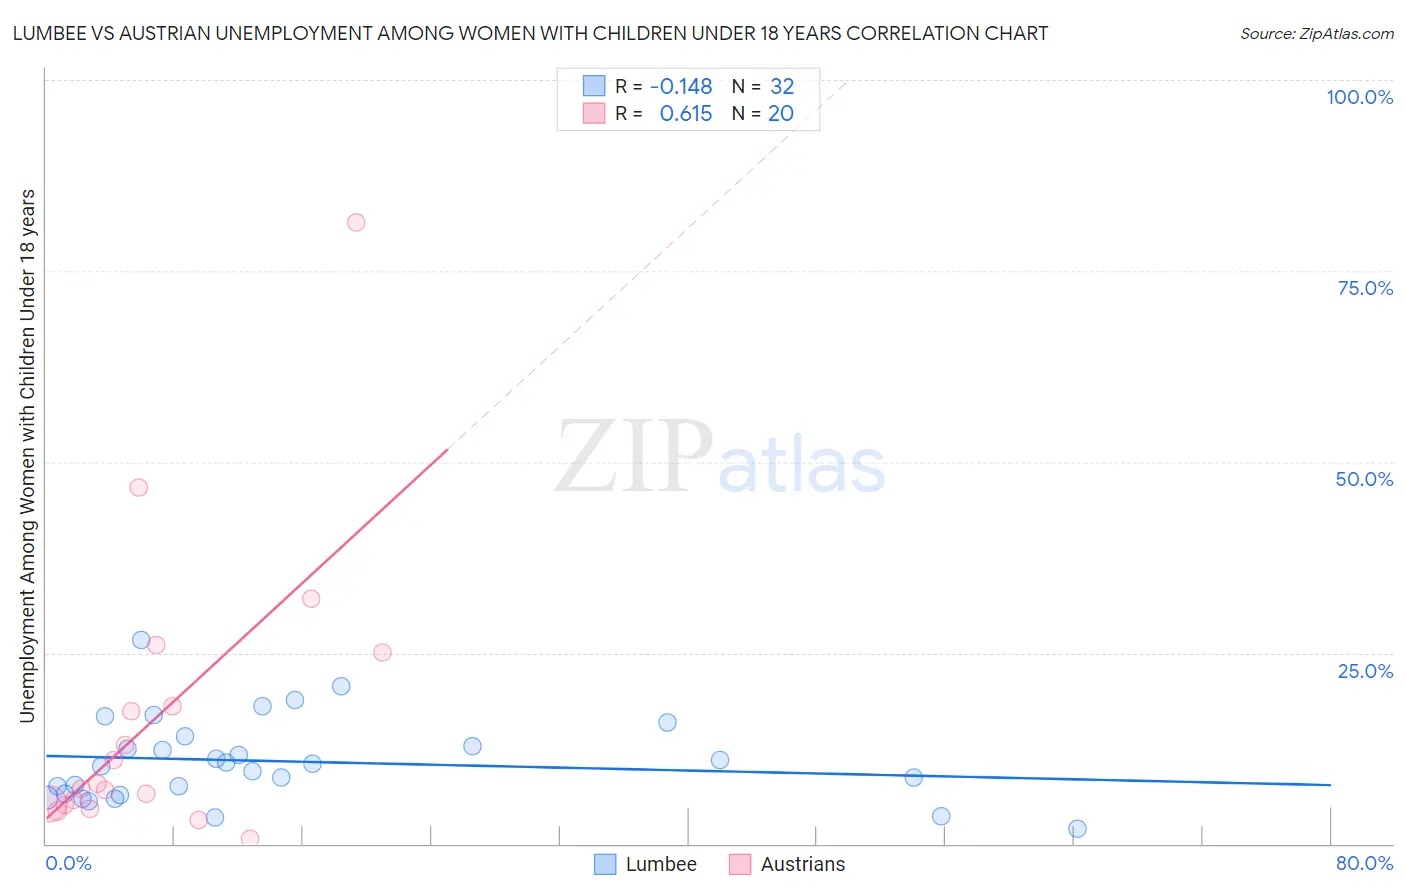
Lumbee vs Austrian Unemployment Among Women with Children Under 18 years Correlation Chart

The statistical analysis conducted on geographies consisting of 90,830,520 people shows a poor negative correlation between the proportion of Lumbee and unemployment rate among women with children under the age of 18 in the United States with a correlation coefficient (R) of -0.148 and weighted average of 7.1%. Similarly, the statistical analysis conducted on geographies consisting of 424,667,756 people shows a significant positive correlation between the proportion of Austrians and unemployment rate among women with children under the age of 18 in the United States with a correlation coefficient (R) of 0.615 and weighted average of 5.1%, a difference of 38.2%.
Lumbee vs Austrian Unemployment Among Women with Children Under 18 years

Unemployment Among Women with Children Under 18 years Correlation Summary

MeasurementLumbeeAustrian
Minimum2.0%0.60%
Maximum26.7%81.3%
Range24.7%80.7%
Mean10.8%16.4%
Median10.3%7.5%
Interquartile 25% (IQ1)6.5%5.2%
Interquartile 75% (IQ3)13.4%21.5%
Interquartile Range (IQR)7.0%16.3%
Standard Deviation (Sample)5.5%19.2%
Standard Deviation (Population)5.4%18.7%

Similar Demographics by Unemployment Among Women with Children Under 18 years

Demographics Similar to Lumbee by Unemployment Among Women with Children Under 18 years

In terms of unemployment among women with children under 18 years, the demographic groups most similar to Lumbee are Chippewa (7.0%, a difference of 0.86%), Immigrants from Dominica (7.0%, a difference of 1.6%), Native/Alaskan (7.2%, a difference of 2.4%), Black/African American (7.3%, a difference of 2.8%), and Paiute (6.9%, a difference of 2.8%).
DemographicsRating | RankUnemployment Among Women with Children Under 18 years
Immigrants | Belize
0.0
/100
|
#320
Tragic
6.7%
U.S. Virgin Islanders
0.0
/100
|
#321
Tragic
6.7%
Houma
0.0
/100
|
#322
Tragic
6.8%
Pueblo
0.0
/100
|
#323
Tragic
6.8%
Paiute
0.0
/100
|
#324
Tragic
6.9%
Immigrants | Dominica
0.0
/100
|
#325
Tragic
7.0%
Chippewa
0.0
/100
|
#326
Tragic
7.0%
Lumbee
0.0
/100
|
#327
Tragic
7.1%
Natives/Alaskans
0.0
/100
|
#328
Tragic
7.2%
Blacks/African Americans
0.0
/100
|
#329
Tragic
7.3%
Colville
0.0
/100
|
#330
Tragic
7.4%
Hopi
0.0
/100
|
#331
Tragic
7.4%
Dominicans
0.0
/100
|
#332
Tragic
7.5%
Immigrants | Dominican Republic
0.0
/100
|
#333
Tragic
7.5%
Cheyenne
0.0
/100
|
#334
Tragic
7.8%

Demographics Similar to Austrians by Unemployment Among Women with Children Under 18 years

In terms of unemployment among women with children under 18 years, the demographic groups most similar to Austrians are Icelander (5.1%, a difference of 0.0%), Serbian (5.1%, a difference of 0.040%), Irish (5.1%, a difference of 0.14%), Fijian (5.1%, a difference of 0.23%), and Immigrants from Australia (5.1%, a difference of 0.25%).
DemographicsRating | RankUnemployment Among Women with Children Under 18 years
Immigrants | Bulgaria
97.4
/100
|
#62
Exceptional
5.1%
Italians
97.4
/100
|
#63
Exceptional
5.1%
Estonians
97.2
/100
|
#64
Exceptional
5.1%
Immigrants | Sweden
97.1
/100
|
#65
Exceptional
5.1%
Immigrants | Australia
97.0
/100
|
#66
Exceptional
5.1%
Fijians
96.9
/100
|
#67
Exceptional
5.1%
Irish
96.8
/100
|
#68
Exceptional
5.1%
Austrians
96.6
/100
|
#69
Exceptional
5.1%
Icelanders
96.6
/100
|
#70
Exceptional
5.1%
Serbians
96.5
/100
|
#71
Exceptional
5.1%
Immigrants | Bolivia
96.1
/100
|
#72
Exceptional
5.1%
Albanians
95.9
/100
|
#73
Exceptional
5.1%
Immigrants | Northern Europe
95.9
/100
|
#74
Exceptional
5.1%
Immigrants | Asia
95.8
/100
|
#75
Exceptional
5.1%
Puget Sound Salish
95.8
/100
|
#76
Exceptional
5.1%