Lumbee vs Alaskan Athabascan Male Unemployment
COMPARE
Lumbee
Alaskan Athabascan
Male Unemployment
Male Unemployment Comparison
Lumbee
Alaskan Athabascans
6.9%
MALE UNEMPLOYMENT
0.0/ 100
METRIC RATING
312th/ 347
METRIC RANK
9.8%
MALE UNEMPLOYMENT
0.0/ 100
METRIC RATING
340th/ 347
METRIC RANK
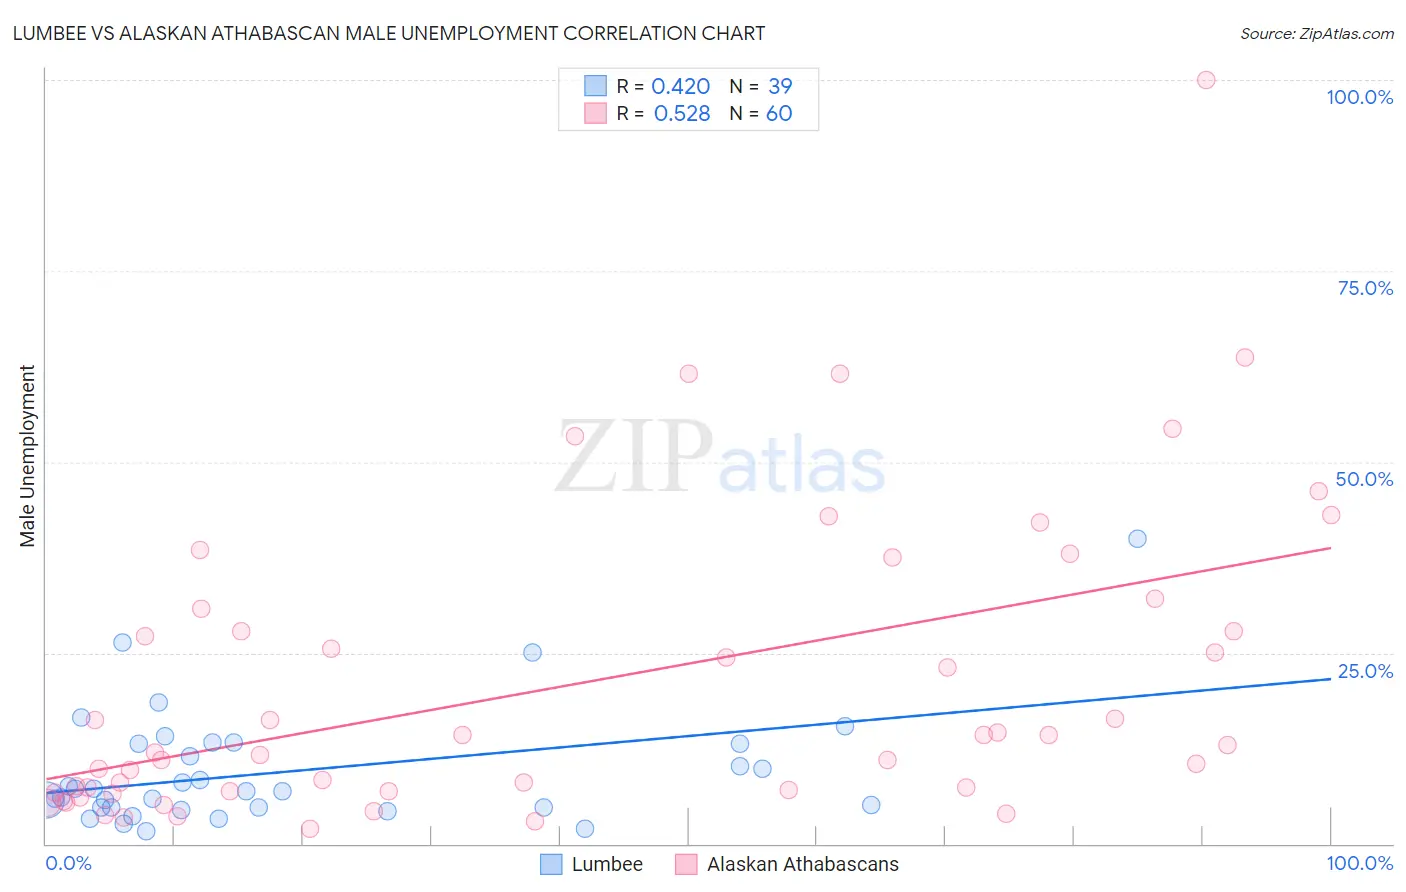
Lumbee vs Alaskan Athabascan Male Unemployment Correlation Chart
The statistical analysis conducted on geographies consisting of 92,069,666 people shows a moderate positive correlation between the proportion of Lumbee and unemployment rate among males in the United States with a correlation coefficient (R) of 0.420 and weighted average of 6.9%. Similarly, the statistical analysis conducted on geographies consisting of 45,763,974 people shows a substantial positive correlation between the proportion of Alaskan Athabascans and unemployment rate among males in the United States with a correlation coefficient (R) of 0.528 and weighted average of 9.8%, a difference of 41.4%.
Male Unemployment Correlation Summary
| Measurement | Lumbee | Alaskan Athabascan |
| Minimum | 1.7% | 2.0% |
| Maximum | 40.0% | 100.0% |
| Range | 38.3% | 98.0% |
| Mean | 9.5% | 20.9% |
| Median | 6.8% | 12.5% |
| Interquartile 25% (IQ1) | 4.8% | 6.8% |
| Interquartile 75% (IQ3) | 13.1% | 29.4% |
| Interquartile Range (IQR) | 8.4% | 22.5% |
| Standard Deviation (Sample) | 7.7% | 19.9% |
| Standard Deviation (Population) | 7.6% | 19.7% |
Similar Demographics by Male Unemployment
Demographics Similar to Lumbee by Male Unemployment
In terms of male unemployment, the demographic groups most similar to Lumbee are Immigrants from Armenia (6.9%, a difference of 0.20%), Black/African American (6.9%, a difference of 0.52%), Immigrants from Dominica (7.0%, a difference of 1.0%), Barbadian (6.9%, a difference of 1.2%), and Aleut (6.8%, a difference of 1.6%).
| Demographics | Rating | Rank | Male Unemployment |
| Trinidadians and Tobagonians | 0.0 /100 | #305 | Tragic 6.7% |
| Immigrants | Trinidad and Tobago | 0.0 /100 | #306 | Tragic 6.7% |
| Immigrants | Jamaica | 0.0 /100 | #307 | Tragic 6.7% |
| Aleuts | 0.0 /100 | #308 | Tragic 6.8% |
| Barbadians | 0.0 /100 | #309 | Tragic 6.9% |
| Blacks/African Americans | 0.0 /100 | #310 | Tragic 6.9% |
| Immigrants | Armenia | 0.0 /100 | #311 | Tragic 6.9% |
| Lumbee | 0.0 /100 | #312 | Tragic 6.9% |
| Immigrants | Dominica | 0.0 /100 | #313 | Tragic 7.0% |
| Immigrants | Barbados | 0.0 /100 | #314 | Tragic 7.1% |
| Houma | 0.0 /100 | #315 | Tragic 7.1% |
| Immigrants | Guyana | 0.0 /100 | #316 | Tragic 7.1% |
| Guyanese | 0.0 /100 | #317 | Tragic 7.1% |
| Cape Verdeans | 0.0 /100 | #318 | Tragic 7.1% |
| British West Indians | 0.0 /100 | #319 | Tragic 7.3% |
Demographics Similar to Alaskan Athabascans by Male Unemployment
In terms of male unemployment, the demographic groups most similar to Alaskan Athabascans are Cheyenne (9.8%, a difference of 0.080%), Navajo (9.8%, a difference of 0.28%), Tohono O'odham (10.2%, a difference of 3.7%), Crow (10.6%, a difference of 8.2%), and Hopi (10.8%, a difference of 10.0%).
| Demographics | Rating | Rank | Male Unemployment |
| Sioux | 0.0 /100 | #333 | Tragic 8.4% |
| Tsimshian | 0.0 /100 | #334 | Tragic 8.5% |
| Pueblo | 0.0 /100 | #335 | Tragic 8.5% |
| Yuman | 0.0 /100 | #336 | Tragic 8.6% |
| Puerto Ricans | 0.0 /100 | #337 | Tragic 8.6% |
| Apache | 0.0 /100 | #338 | Tragic 8.6% |
| Cheyenne | 0.0 /100 | #339 | Tragic 9.8% |
| Alaskan Athabascans | 0.0 /100 | #340 | Tragic 9.8% |
| Navajo | 0.0 /100 | #341 | Tragic 9.8% |
| Tohono O'odham | 0.0 /100 | #342 | Tragic 10.2% |
| Crow | 0.0 /100 | #343 | Tragic 10.6% |
| Hopi | 0.0 /100 | #344 | Tragic 10.8% |
| Arapaho | 0.0 /100 | #345 | Tragic 11.0% |
| Inupiat | 0.0 /100 | #346 | Tragic 12.1% |
| Yup'ik | 0.0 /100 | #347 | Tragic 16.4% |