Lithuanian vs Inupiat Female Unemployment
COMPARE
Lithuanian
Inupiat
Female Unemployment
Female Unemployment Comparison
Lithuanians
Inupiat
4.7%
FEMALE UNEMPLOYMENT
99.8/ 100
METRIC RATING
30th/ 347
METRIC RANK
8.2%
FEMALE UNEMPLOYMENT
0.0/ 100
METRIC RATING
341st/ 347
METRIC RANK
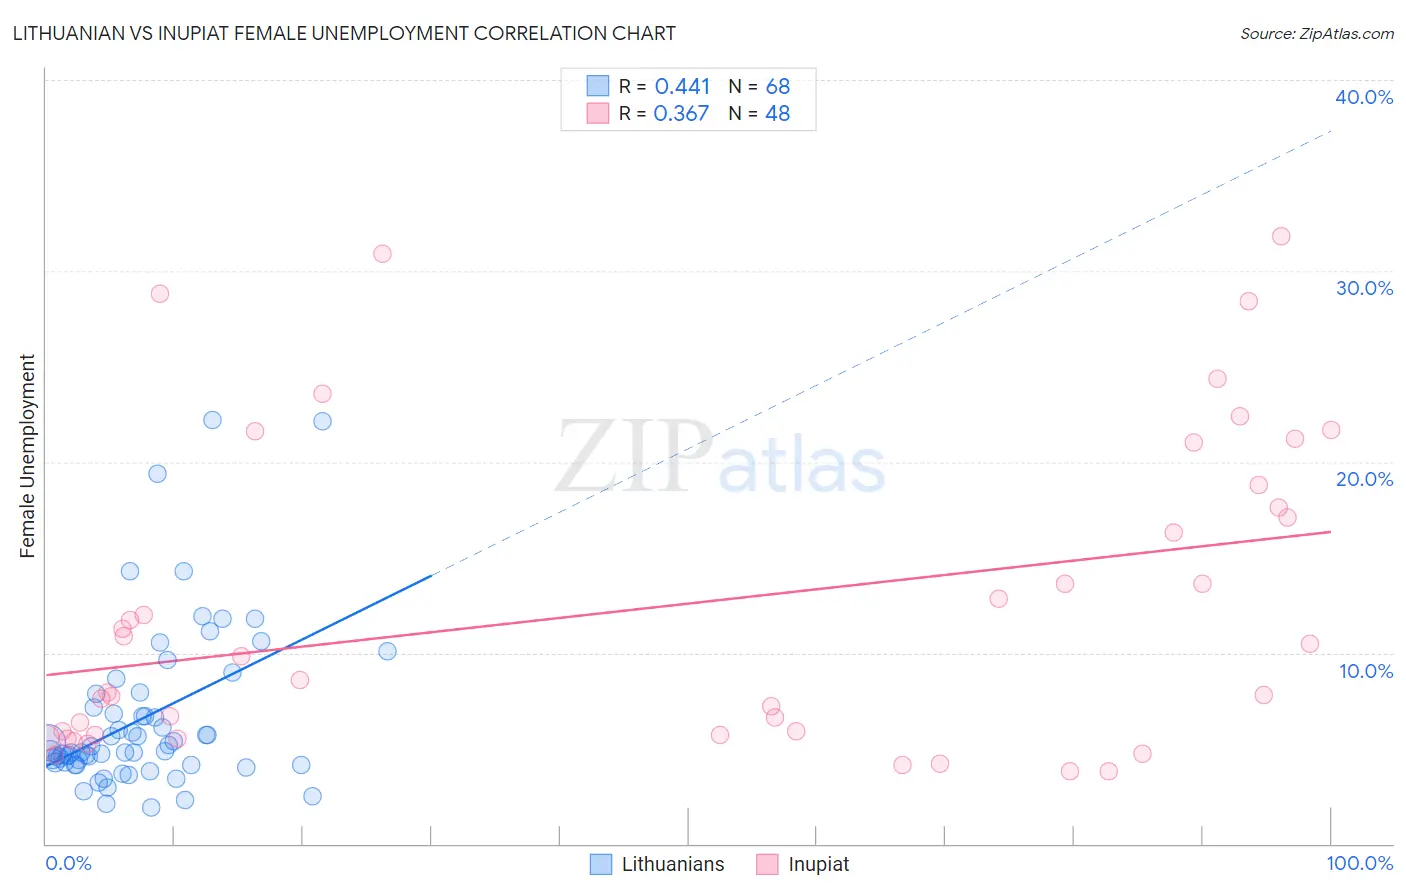
Lithuanian vs Inupiat Female Unemployment Correlation Chart
The statistical analysis conducted on geographies consisting of 418,507,146 people shows a moderate positive correlation between the proportion of Lithuanians and unemploymnet rate among females in the United States with a correlation coefficient (R) of 0.441 and weighted average of 4.7%. Similarly, the statistical analysis conducted on geographies consisting of 96,139,159 people shows a mild positive correlation between the proportion of Inupiat and unemploymnet rate among females in the United States with a correlation coefficient (R) of 0.367 and weighted average of 8.2%, a difference of 71.9%.
Female Unemployment Correlation Summary
| Measurement | Lithuanian | Inupiat |
| Minimum | 1.9% | 3.8% |
| Maximum | 22.2% | 31.8% |
| Range | 20.3% | 28.0% |
| Mean | 6.6% | 12.4% |
| Median | 4.8% | 9.2% |
| Interquartile 25% (IQ1) | 4.2% | 5.7% |
| Interquartile 75% (IQ3) | 7.5% | 18.2% |
| Interquartile Range (IQR) | 3.3% | 12.5% |
| Standard Deviation (Sample) | 4.3% | 8.1% |
| Standard Deviation (Population) | 4.2% | 8.0% |
Similar Demographics by Female Unemployment
Demographics Similar to Lithuanians by Female Unemployment
In terms of female unemployment, the demographic groups most similar to Lithuanians are Cypriot (4.7%, a difference of 0.12%), Irish (4.7%, a difference of 0.13%), British (4.7%, a difference of 0.16%), Sudanese (4.8%, a difference of 0.28%), and Immigrants from Bosnia and Herzegovina (4.7%, a difference of 0.33%).
| Demographics | Rating | Rank | Female Unemployment |
| Scottish | 99.9 /100 | #23 | Exceptional 4.7% |
| Welsh | 99.9 /100 | #24 | Exceptional 4.7% |
| Immigrants | India | 99.9 /100 | #25 | Exceptional 4.7% |
| Immigrants | Bosnia and Herzegovina | 99.9 /100 | #26 | Exceptional 4.7% |
| British | 99.9 /100 | #27 | Exceptional 4.7% |
| Irish | 99.9 /100 | #28 | Exceptional 4.7% |
| Cypriots | 99.9 /100 | #29 | Exceptional 4.7% |
| Lithuanians | 99.8 /100 | #30 | Exceptional 4.7% |
| Sudanese | 99.8 /100 | #31 | Exceptional 4.8% |
| Slovaks | 99.8 /100 | #32 | Exceptional 4.8% |
| Czechoslovakians | 99.7 /100 | #33 | Exceptional 4.8% |
| Zimbabweans | 99.7 /100 | #34 | Exceptional 4.8% |
| French Canadians | 99.7 /100 | #35 | Exceptional 4.8% |
| Yugoslavians | 99.7 /100 | #36 | Exceptional 4.8% |
| Pennsylvania Germans | 99.6 /100 | #37 | Exceptional 4.8% |
Demographics Similar to Inupiat by Female Unemployment
In terms of female unemployment, the demographic groups most similar to Inupiat are Hopi (8.1%, a difference of 0.76%), Puerto Rican (8.3%, a difference of 2.2%), Immigrants from Yemen (7.8%, a difference of 4.1%), Tohono O'odham (7.7%, a difference of 5.3%), and Arapaho (8.8%, a difference of 7.7%).
| Demographics | Rating | Rank | Female Unemployment |
| Menominee | 0.0 /100 | #333 | Tragic 7.0% |
| Immigrants | Armenia | 0.0 /100 | #334 | Tragic 7.1% |
| Dominicans | 0.0 /100 | #335 | Tragic 7.2% |
| Immigrants | Dominican Republic | 0.0 /100 | #336 | Tragic 7.2% |
| Navajo | 0.0 /100 | #337 | Tragic 7.3% |
| Tohono O'odham | 0.0 /100 | #338 | Tragic 7.7% |
| Immigrants | Yemen | 0.0 /100 | #339 | Tragic 7.8% |
| Hopi | 0.0 /100 | #340 | Tragic 8.1% |
| Inupiat | 0.0 /100 | #341 | Tragic 8.2% |
| Puerto Ricans | 0.0 /100 | #342 | Tragic 8.3% |
| Arapaho | 0.0 /100 | #343 | Tragic 8.8% |
| Pima | 0.0 /100 | #344 | Tragic 9.3% |
| Yuman | 0.0 /100 | #345 | Tragic 9.6% |
| Yup'ik | 0.0 /100 | #346 | Tragic 10.9% |
| Crow | 0.0 /100 | #347 | Tragic 12.1% |