Liberian vs Taiwanese Unemployment Among Women with Children Under 6 years
COMPARE
Liberian
Taiwanese
Unemployment Among Women with Children Under 6 years
Unemployment Among Women with Children Under 6 years Comparison
Liberians
Taiwanese
8.1%
UNEMPLOYMENT AMONG WOMEN WITH CHILDREN UNDER 6 YEARS
2.6/ 100
METRIC RATING
241st/ 347
METRIC RANK
6.1%
UNEMPLOYMENT AMONG WOMEN WITH CHILDREN UNDER 6 YEARS
100.0/ 100
METRIC RATING
7th/ 347
METRIC RANK
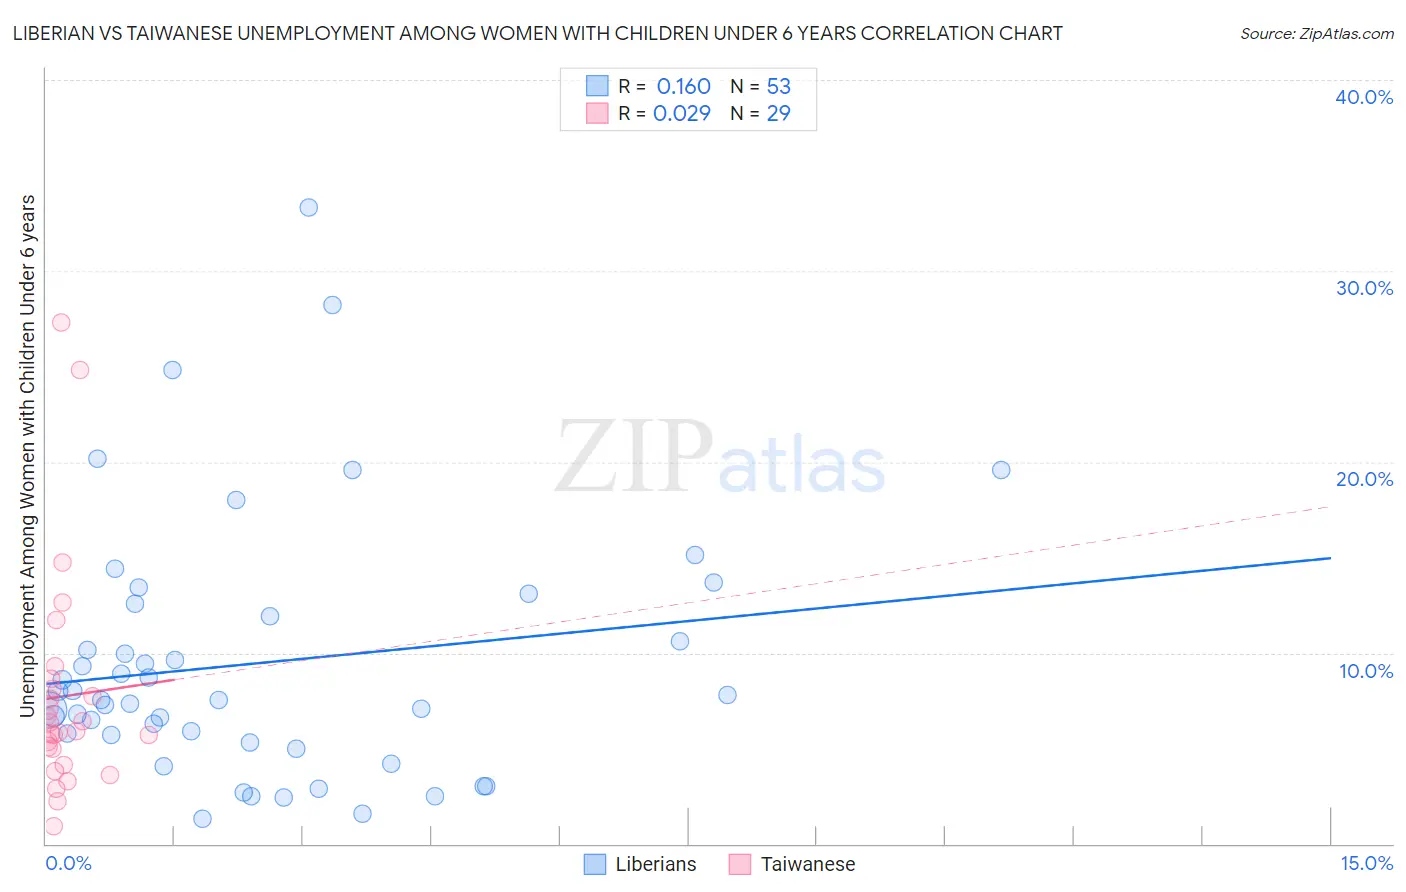
Liberian vs Taiwanese Unemployment Among Women with Children Under 6 years Correlation Chart
The statistical analysis conducted on geographies consisting of 106,761,438 people shows a poor positive correlation between the proportion of Liberians and unemployment rate among women with children under the age of 6 in the United States with a correlation coefficient (R) of 0.160 and weighted average of 8.1%. Similarly, the statistical analysis conducted on geographies consisting of 30,738,294 people shows no correlation between the proportion of Taiwanese and unemployment rate among women with children under the age of 6 in the United States with a correlation coefficient (R) of 0.029 and weighted average of 6.1%, a difference of 33.3%.
Unemployment Among Women with Children Under 6 years Correlation Summary
| Measurement | Liberian | Taiwanese |
| Minimum | 1.3% | 0.90% |
| Maximum | 33.3% | 27.3% |
| Range | 32.0% | 26.4% |
| Mean | 9.5% | 7.7% |
| Median | 7.5% | 5.9% |
| Interquartile 25% (IQ1) | 5.5% | 4.5% |
| Interquartile 75% (IQ3) | 12.2% | 8.4% |
| Interquartile Range (IQR) | 6.7% | 3.9% |
| Standard Deviation (Sample) | 6.7% | 5.9% |
| Standard Deviation (Population) | 6.6% | 5.8% |
Similar Demographics by Unemployment Among Women with Children Under 6 years
Demographics Similar to Liberians by Unemployment Among Women with Children Under 6 years
In terms of unemployment among women with children under 6 years, the demographic groups most similar to Liberians are Immigrants from El Salvador (8.1%, a difference of 0.030%), Dutch (8.1%, a difference of 0.060%), Irish (8.1%, a difference of 0.10%), Immigrants from Middle Africa (8.1%, a difference of 0.36%), and Hawaiian (8.2%, a difference of 0.61%).
| Demographics | Rating | Rank | Unemployment Among Women with Children Under 6 years |
| Kiowa | 4.4 /100 | #234 | Tragic 8.0% |
| Comanche | 4.3 /100 | #235 | Tragic 8.0% |
| Immigrants | Barbados | 4.2 /100 | #236 | Tragic 8.0% |
| Immigrants | Costa Rica | 4.1 /100 | #237 | Tragic 8.0% |
| Immigrants | Middle Africa | 3.2 /100 | #238 | Tragic 8.1% |
| Irish | 2.7 /100 | #239 | Tragic 8.1% |
| Immigrants | El Salvador | 2.6 /100 | #240 | Tragic 8.1% |
| Liberians | 2.6 /100 | #241 | Tragic 8.1% |
| Dutch | 2.5 /100 | #242 | Tragic 8.1% |
| Hawaiians | 1.8 /100 | #243 | Tragic 8.2% |
| French | 1.7 /100 | #244 | Tragic 8.2% |
| Native Hawaiians | 1.7 /100 | #245 | Tragic 8.2% |
| Central Americans | 1.4 /100 | #246 | Tragic 8.2% |
| German Russians | 1.2 /100 | #247 | Tragic 8.2% |
| Immigrants | Western Africa | 1.1 /100 | #248 | Tragic 8.2% |
Demographics Similar to Taiwanese by Unemployment Among Women with Children Under 6 years
In terms of unemployment among women with children under 6 years, the demographic groups most similar to Taiwanese are Immigrants from India (6.1%, a difference of 0.49%), Immigrants from Taiwan (6.0%, a difference of 0.52%), Filipino (6.1%, a difference of 0.94%), Cape Verdean (5.9%, a difference of 2.2%), and Immigrants from China (6.2%, a difference of 2.4%).
| Demographics | Rating | Rank | Unemployment Among Women with Children Under 6 years |
| Immigrants | Cabo Verde | 100.0 /100 | #1 | Exceptional 5.4% |
| Immigrants | Hong Kong | 100.0 /100 | #2 | Exceptional 5.8% |
| Okinawans | 100.0 /100 | #3 | Exceptional 5.8% |
| Cambodians | 100.0 /100 | #4 | Exceptional 5.9% |
| Cape Verdeans | 100.0 /100 | #5 | Exceptional 5.9% |
| Immigrants | Taiwan | 100.0 /100 | #6 | Exceptional 6.0% |
| Taiwanese | 100.0 /100 | #7 | Exceptional 6.1% |
| Immigrants | India | 100.0 /100 | #8 | Exceptional 6.1% |
| Filipinos | 100.0 /100 | #9 | Exceptional 6.1% |
| Immigrants | China | 100.0 /100 | #10 | Exceptional 6.2% |
| Indians (Asian) | 100.0 /100 | #11 | Exceptional 6.3% |
| Immigrants | Singapore | 100.0 /100 | #12 | Exceptional 6.3% |
| Immigrants | Eastern Asia | 100.0 /100 | #13 | Exceptional 6.3% |
| Immigrants | Bulgaria | 100.0 /100 | #14 | Exceptional 6.3% |
| Thais | 100.0 /100 | #15 | Exceptional 6.3% |