Liberian vs Puget Sound Salish Unemployment Among Ages 16 to 19 years
COMPARE
Liberian
Puget Sound Salish
Unemployment Among Ages 16 to 19 years
Unemployment Among Ages 16 to 19 years Comparison
Liberians
Puget Sound Salish
17.9%
UNEMPLOYMENT AMONG AGES 16 TO 19 YEARS
18.6/ 100
METRIC RATING
207th/ 347
METRIC RANK
18.7%
UNEMPLOYMENT AMONG AGES 16 TO 19 YEARS
0.5/ 100
METRIC RATING
249th/ 347
METRIC RANK
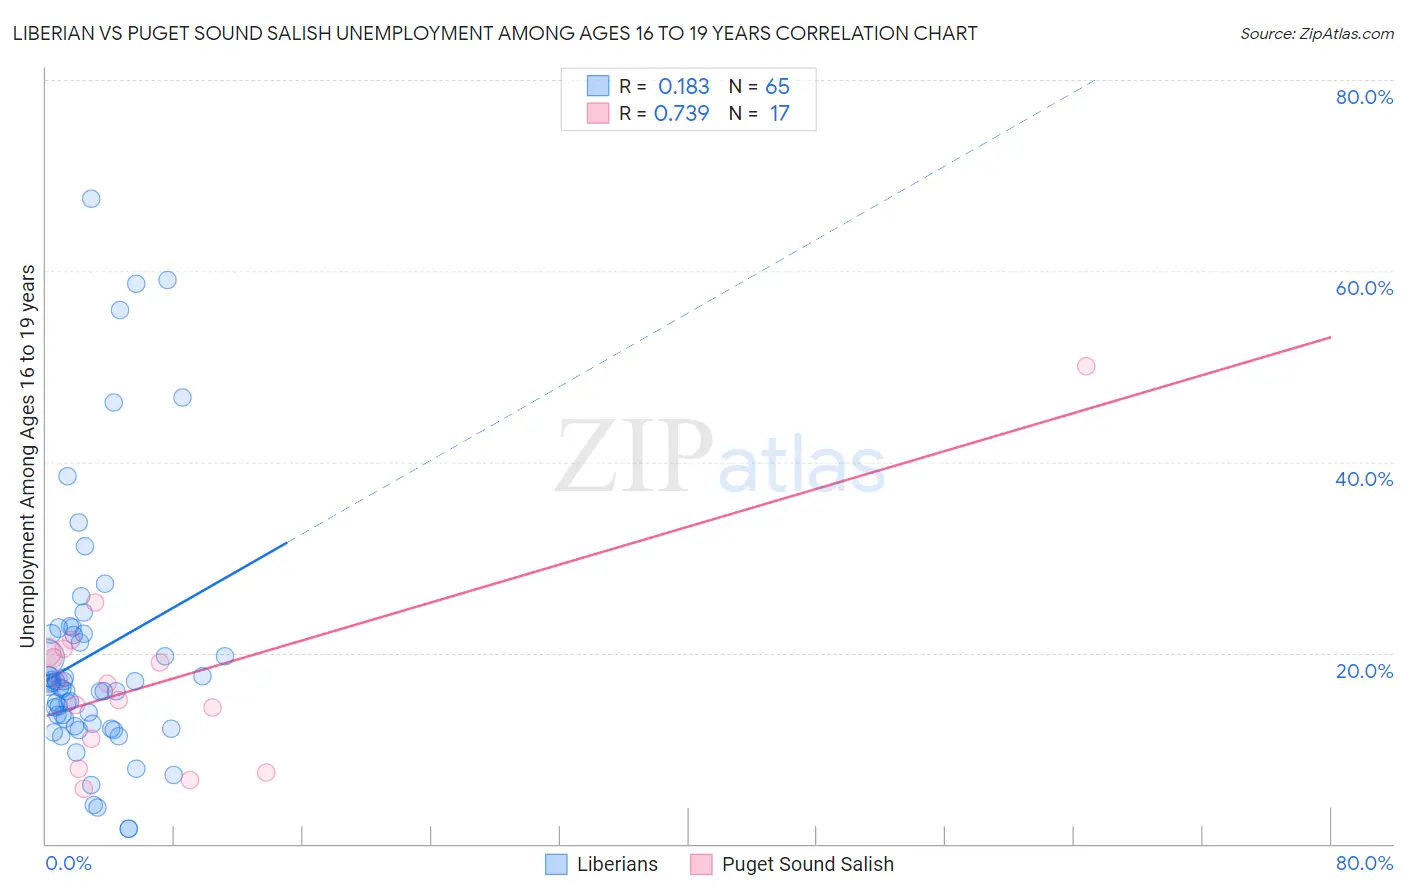
Liberian vs Puget Sound Salish Unemployment Among Ages 16 to 19 years Correlation Chart
The statistical analysis conducted on geographies consisting of 116,388,643 people shows a poor positive correlation between the proportion of Liberians and unemployment rate among population between the ages 16 and 19 in the United States with a correlation coefficient (R) of 0.183 and weighted average of 17.9%. Similarly, the statistical analysis conducted on geographies consisting of 45,291,047 people shows a strong positive correlation between the proportion of Puget Sound Salish and unemployment rate among population between the ages 16 and 19 in the United States with a correlation coefficient (R) of 0.739 and weighted average of 18.7%, a difference of 4.5%.
Unemployment Among Ages 16 to 19 years Correlation Summary
| Measurement | Liberian | Puget Sound Salish |
| Minimum | 1.6% | 5.8% |
| Maximum | 67.6% | 50.0% |
| Range | 66.0% | 44.2% |
| Mean | 19.8% | 17.2% |
| Median | 16.7% | 16.7% |
| Interquartile 25% (IQ1) | 12.4% | 9.4% |
| Interquartile 75% (IQ3) | 22.0% | 20.2% |
| Interquartile Range (IQR) | 9.6% | 10.8% |
| Standard Deviation (Sample) | 13.5% | 10.2% |
| Standard Deviation (Population) | 13.4% | 9.9% |
Similar Demographics by Unemployment Among Ages 16 to 19 years
Demographics Similar to Liberians by Unemployment Among Ages 16 to 19 years
In terms of unemployment among ages 16 to 19 years, the demographic groups most similar to Liberians are Immigrants from Southern Europe (17.9%, a difference of 0.020%), Hawaiian (17.9%, a difference of 0.15%), Nonimmigrants (17.9%, a difference of 0.16%), Assyrian/Chaldean/Syriac (17.9%, a difference of 0.16%), and Cherokee (17.9%, a difference of 0.24%).
| Demographics | Rating | Rank | Unemployment Among Ages 16 to 19 years |
| Immigrants | Fiji | 27.7 /100 | #200 | Fair 17.8% |
| Immigrants | Ethiopia | 27.4 /100 | #201 | Fair 17.8% |
| Immigrants | Portugal | 27.2 /100 | #202 | Fair 17.8% |
| Immigrants | Eastern Europe | 23.6 /100 | #203 | Fair 17.8% |
| Immigrants | Nonimmigrants | 20.9 /100 | #204 | Fair 17.9% |
| Assyrians/Chaldeans/Syriacs | 20.8 /100 | #205 | Fair 17.9% |
| Immigrants | Southern Europe | 18.9 /100 | #206 | Poor 17.9% |
| Liberians | 18.6 /100 | #207 | Poor 17.9% |
| Hawaiians | 16.8 /100 | #208 | Poor 17.9% |
| Cherokee | 15.7 /100 | #209 | Poor 17.9% |
| Carpatho Rusyns | 15.6 /100 | #210 | Poor 17.9% |
| Guamanians/Chamorros | 14.5 /100 | #211 | Poor 17.9% |
| Argentineans | 13.8 /100 | #212 | Poor 18.0% |
| Chippewa | 13.7 /100 | #213 | Poor 18.0% |
| Immigrants | Morocco | 13.5 /100 | #214 | Poor 18.0% |
Demographics Similar to Puget Sound Salish by Unemployment Among Ages 16 to 19 years
In terms of unemployment among ages 16 to 19 years, the demographic groups most similar to Puget Sound Salish are Delaware (18.7%, a difference of 0.060%), Immigrants from Israel (18.7%, a difference of 0.090%), Panamanian (18.7%, a difference of 0.11%), Immigrants from South America (18.7%, a difference of 0.14%), and Subsaharan African (18.7%, a difference of 0.22%).
| Demographics | Rating | Rank | Unemployment Among Ages 16 to 19 years |
| Moroccans | 1.1 /100 | #242 | Tragic 18.5% |
| Mexicans | 0.9 /100 | #243 | Tragic 18.5% |
| Guatemalans | 0.8 /100 | #244 | Tragic 18.6% |
| Immigrants | Belarus | 0.8 /100 | #245 | Tragic 18.6% |
| Immigrants | South America | 0.5 /100 | #246 | Tragic 18.7% |
| Immigrants | Israel | 0.5 /100 | #247 | Tragic 18.7% |
| Delaware | 0.5 /100 | #248 | Tragic 18.7% |
| Puget Sound Salish | 0.5 /100 | #249 | Tragic 18.7% |
| Panamanians | 0.4 /100 | #250 | Tragic 18.7% |
| Sub-Saharan Africans | 0.4 /100 | #251 | Tragic 18.7% |
| Immigrants | Guatemala | 0.4 /100 | #252 | Tragic 18.7% |
| Central Americans | 0.3 /100 | #253 | Tragic 18.8% |
| Apache | 0.3 /100 | #254 | Tragic 18.8% |
| Immigrants | Cameroon | 0.3 /100 | #255 | Tragic 18.8% |
| Mexican American Indians | 0.3 /100 | #256 | Tragic 18.8% |