Liberian vs Immigrants from Denmark Unemployment Among Ages 45 to 54 years
COMPARE
Liberian
Immigrants from Denmark
Unemployment Among Ages 45 to 54 years
Unemployment Among Ages 45 to 54 years Comparison
Liberians
Immigrants from Denmark
4.6%
UNEMPLOYMENT AMONG AGES 45 TO 54 YEARS
18.7/ 100
METRIC RATING
203rd/ 347
METRIC RANK
4.6%
UNEMPLOYMENT AMONG AGES 45 TO 54 YEARS
19.8/ 100
METRIC RATING
200th/ 347
METRIC RANK
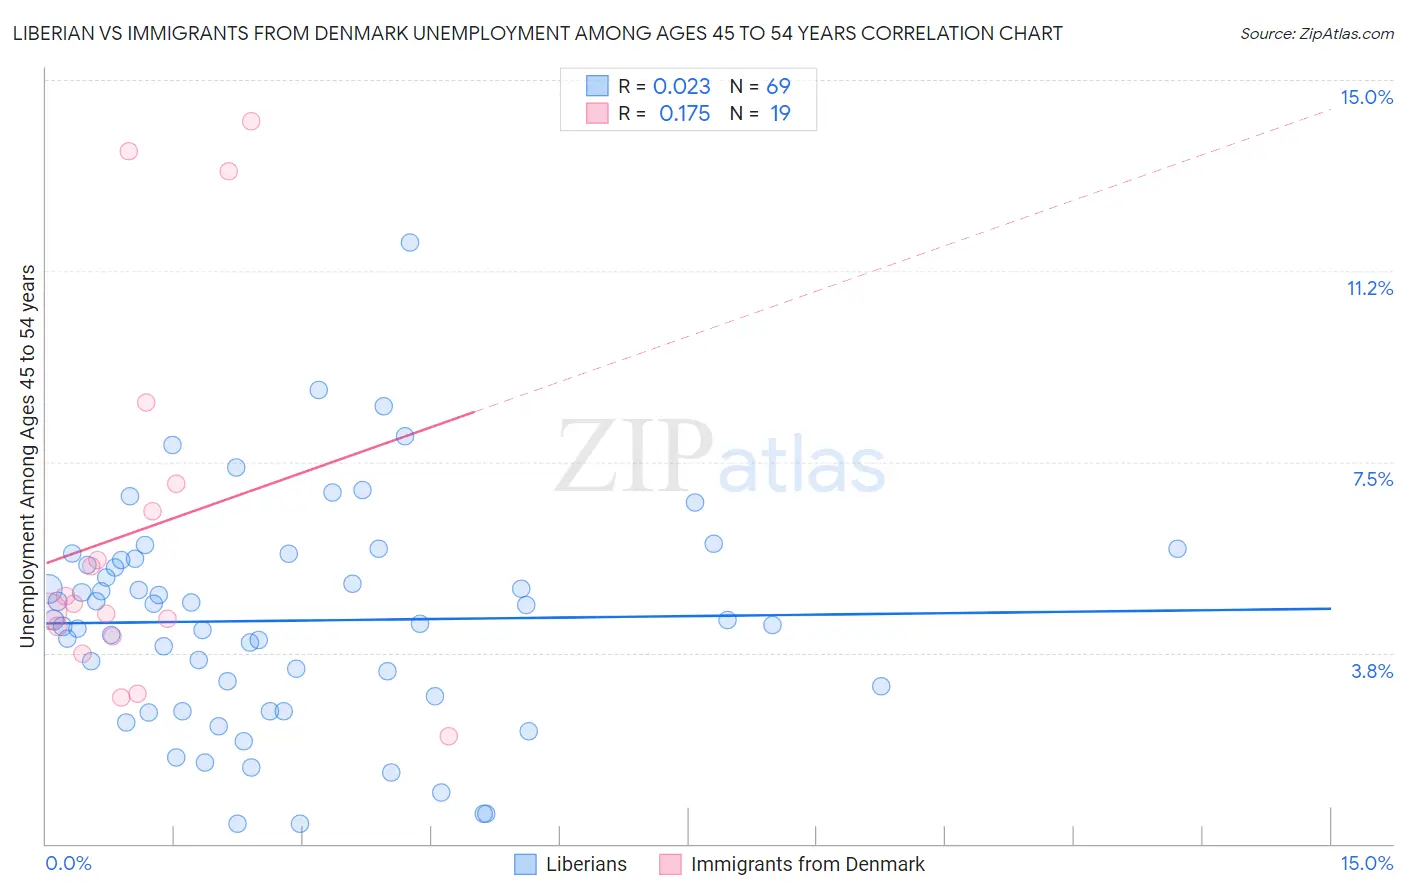
Liberian vs Immigrants from Denmark Unemployment Among Ages 45 to 54 years Correlation Chart
The statistical analysis conducted on geographies consisting of 117,212,866 people shows no correlation between the proportion of Liberians and unemployment rate among population between the ages 45 and 54 in the United States with a correlation coefficient (R) of 0.023 and weighted average of 4.6%. Similarly, the statistical analysis conducted on geographies consisting of 134,998,285 people shows a poor positive correlation between the proportion of Immigrants from Denmark and unemployment rate among population between the ages 45 and 54 in the United States with a correlation coefficient (R) of 0.175 and weighted average of 4.6%, a difference of 0.080%.
Unemployment Among Ages 45 to 54 years Correlation Summary
| Measurement | Liberian | Immigrants from Denmark |
| Minimum | 0.40% | 2.1% |
| Maximum | 11.8% | 14.2% |
| Range | 11.4% | 12.1% |
| Mean | 4.4% | 6.2% |
| Median | 4.4% | 4.7% |
| Interquartile 25% (IQ1) | 2.8% | 4.1% |
| Interquartile 75% (IQ3) | 5.6% | 7.1% |
| Interquartile Range (IQR) | 2.8% | 3.0% |
| Standard Deviation (Sample) | 2.2% | 3.7% |
| Standard Deviation (Population) | 2.1% | 3.6% |
Demographics Similar to Liberians and Immigrants from Denmark by Unemployment Among Ages 45 to 54 years
In terms of unemployment among ages 45 to 54 years, the demographic groups most similar to Liberians are Immigrants from Peru (4.6%, a difference of 0.030%), Immigrants from Costa Rica (4.6%, a difference of 0.070%), Brazilian (4.6%, a difference of 0.10%), Immigrants from Morocco (4.6%, a difference of 0.15%), and Immigrants from Greece (4.6%, a difference of 0.20%). Similarly, the demographic groups most similar to Immigrants from Denmark are Immigrants from Costa Rica (4.6%, a difference of 0.010%), Brazilian (4.6%, a difference of 0.020%), Immigrants from Peru (4.6%, a difference of 0.060%), Immigrants from Morocco (4.6%, a difference of 0.23%), and Immigrants from Greece (4.6%, a difference of 0.28%).
| Demographics | Rating | Rank | Unemployment Among Ages 45 to 54 years |
| Immigrants | Uruguay | 34.4 /100 | #191 | Fair 4.6% |
| Immigrants | Thailand | 34.1 /100 | #192 | Fair 4.6% |
| Immigrants | Lithuania | 33.2 /100 | #193 | Fair 4.6% |
| South Americans | 32.9 /100 | #194 | Fair 4.6% |
| Peruvians | 31.5 /100 | #195 | Fair 4.6% |
| Estonians | 31.2 /100 | #196 | Fair 4.6% |
| Albanians | 31.1 /100 | #197 | Fair 4.6% |
| Immigrants | Belarus | 30.6 /100 | #198 | Fair 4.6% |
| Brazilians | 20.1 /100 | #199 | Fair 4.6% |
| Immigrants | Denmark | 19.8 /100 | #200 | Poor 4.6% |
| Immigrants | Costa Rica | 19.7 /100 | #201 | Poor 4.6% |
| Immigrants | Peru | 19.1 /100 | #202 | Poor 4.6% |
| Liberians | 18.7 /100 | #203 | Poor 4.6% |
| Immigrants | Morocco | 16.8 /100 | #204 | Poor 4.6% |
| Immigrants | Greece | 16.2 /100 | #205 | Poor 4.6% |
| Immigrants | Switzerland | 14.0 /100 | #206 | Poor 4.6% |
| Arabs | 13.7 /100 | #207 | Poor 4.6% |
| Immigrants | Africa | 13.6 /100 | #208 | Poor 4.6% |
| Immigrants | Nigeria | 13.3 /100 | #209 | Poor 4.6% |
| Immigrants | South America | 12.2 /100 | #210 | Poor 4.6% |
| Creek | 11.9 /100 | #211 | Poor 4.6% |