Liberian vs Cheyenne Unemployment Among Ages 55 to 59 years
COMPARE
Liberian
Cheyenne
Unemployment Among Ages 55 to 59 years
Unemployment Among Ages 55 to 59 years Comparison
Liberians
Cheyenne
5.1%
UNEMPLOYMENT AMONG AGES 55 TO 59 YEARS
0.9/ 100
METRIC RATING
242nd/ 347
METRIC RANK
5.1%
UNEMPLOYMENT AMONG AGES 55 TO 59 YEARS
0.4/ 100
METRIC RATING
250th/ 347
METRIC RANK
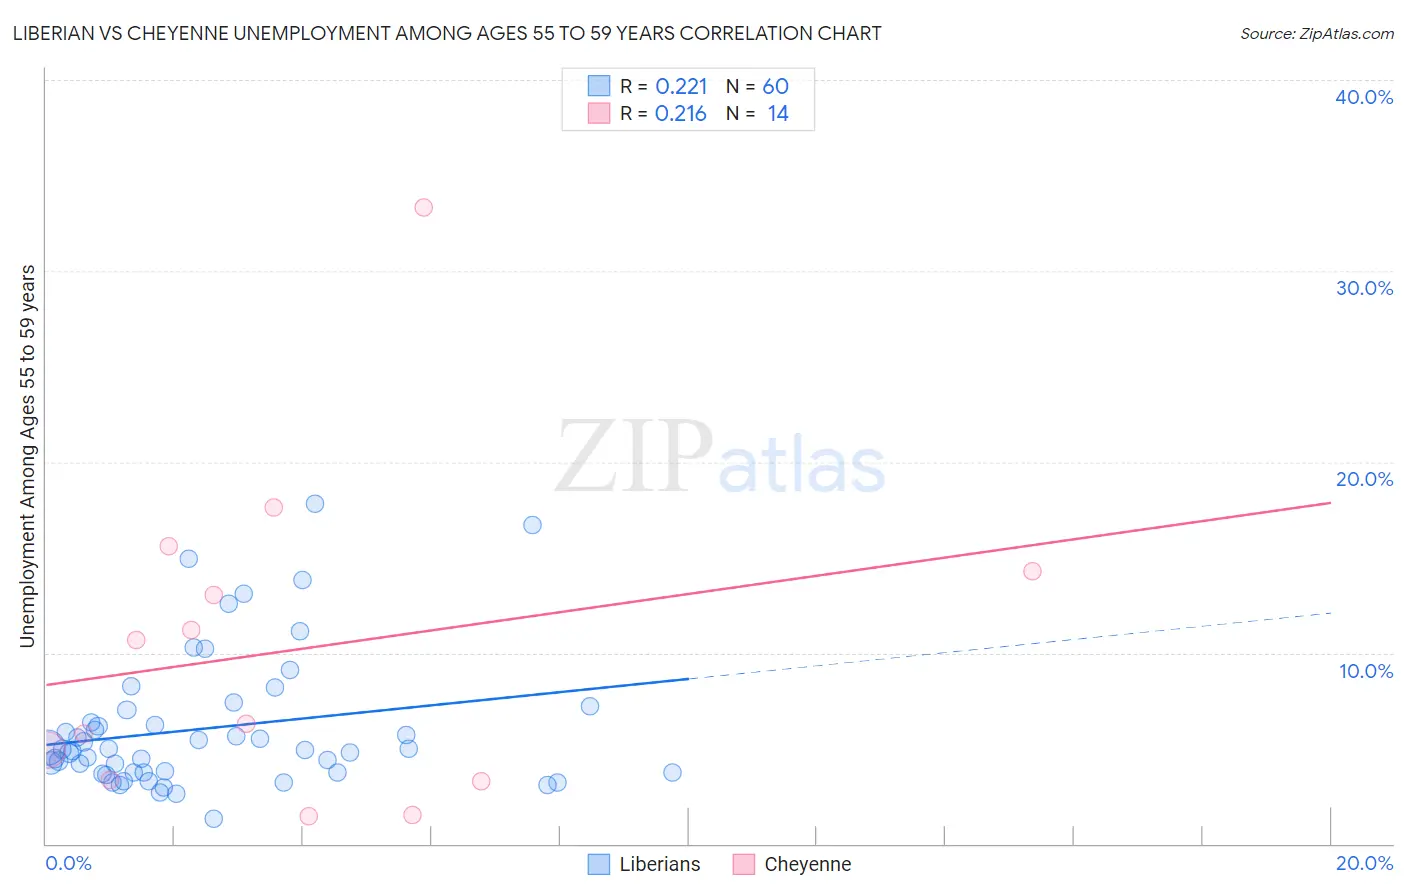
Liberian vs Cheyenne Unemployment Among Ages 55 to 59 years Correlation Chart
The statistical analysis conducted on geographies consisting of 115,549,867 people shows a weak positive correlation between the proportion of Liberians and unemployment rate among population between the ages 55 and 59 in the United States with a correlation coefficient (R) of 0.221 and weighted average of 5.1%. Similarly, the statistical analysis conducted on geographies consisting of 78,086,348 people shows a weak positive correlation between the proportion of Cheyenne and unemployment rate among population between the ages 55 and 59 in the United States with a correlation coefficient (R) of 0.216 and weighted average of 5.1%, a difference of 0.84%.
Unemployment Among Ages 55 to 59 years Correlation Summary
| Measurement | Liberian | Cheyenne |
| Minimum | 1.3% | 1.4% |
| Maximum | 17.8% | 33.3% |
| Range | 16.5% | 31.9% |
| Mean | 6.1% | 10.2% |
| Median | 4.9% | 8.5% |
| Interquartile 25% (IQ1) | 3.7% | 3.4% |
| Interquartile 75% (IQ3) | 6.7% | 14.3% |
| Interquartile Range (IQR) | 3.0% | 10.9% |
| Standard Deviation (Sample) | 3.6% | 8.6% |
| Standard Deviation (Population) | 3.5% | 8.3% |
Demographics Similar to Liberians and Cheyenne by Unemployment Among Ages 55 to 59 years
In terms of unemployment among ages 55 to 59 years, the demographic groups most similar to Liberians are Brazilian (5.0%, a difference of 0.18%), Honduran (5.1%, a difference of 0.21%), Immigrants from Costa Rica (5.0%, a difference of 0.22%), Immigrants from Fiji (5.1%, a difference of 0.22%), and French American Indian (5.0%, a difference of 0.35%). Similarly, the demographic groups most similar to Cheyenne are Portuguese (5.1%, a difference of 0.070%), U.S. Virgin Islander (5.1%, a difference of 0.090%), Paraguayan (5.1%, a difference of 0.13%), Seminole (5.1%, a difference of 0.16%), and Comanche (5.1%, a difference of 0.18%).
| Demographics | Rating | Rank | Unemployment Among Ages 55 to 59 years |
| Immigrants | Albania | 1.3 /100 | #236 | Tragic 5.0% |
| Choctaw | 1.3 /100 | #237 | Tragic 5.0% |
| Moroccans | 1.3 /100 | #238 | Tragic 5.0% |
| French American Indians | 1.2 /100 | #239 | Tragic 5.0% |
| Immigrants | Costa Rica | 1.1 /100 | #240 | Tragic 5.0% |
| Brazilians | 1.0 /100 | #241 | Tragic 5.0% |
| Liberians | 0.9 /100 | #242 | Tragic 5.1% |
| Hondurans | 0.7 /100 | #243 | Tragic 5.1% |
| Immigrants | Fiji | 0.7 /100 | #244 | Tragic 5.1% |
| Soviet Union | 0.6 /100 | #245 | Tragic 5.1% |
| Immigrants | Greece | 0.6 /100 | #246 | Tragic 5.1% |
| Immigrants | Honduras | 0.5 /100 | #247 | Tragic 5.1% |
| Native Hawaiians | 0.5 /100 | #248 | Tragic 5.1% |
| Comanche | 0.4 /100 | #249 | Tragic 5.1% |
| Cheyenne | 0.4 /100 | #250 | Tragic 5.1% |
| Portuguese | 0.3 /100 | #251 | Tragic 5.1% |
| U.S. Virgin Islanders | 0.3 /100 | #252 | Tragic 5.1% |
| Paraguayans | 0.3 /100 | #253 | Tragic 5.1% |
| Seminole | 0.3 /100 | #254 | Tragic 5.1% |
| Blackfeet | 0.3 /100 | #255 | Tragic 5.1% |
| Senegalese | 0.3 /100 | #256 | Tragic 5.1% |