Lebanese vs Immigrants from Dominican Republic Female Unemployment
COMPARE
Lebanese
Immigrants from Dominican Republic
Female Unemployment
Female Unemployment Comparison
Lebanese
Immigrants from Dominican Republic
5.1%
FEMALE UNEMPLOYMENT
91.0/ 100
METRIC RATING
115th/ 347
METRIC RANK
7.2%
FEMALE UNEMPLOYMENT
0.0/ 100
METRIC RATING
336th/ 347
METRIC RANK
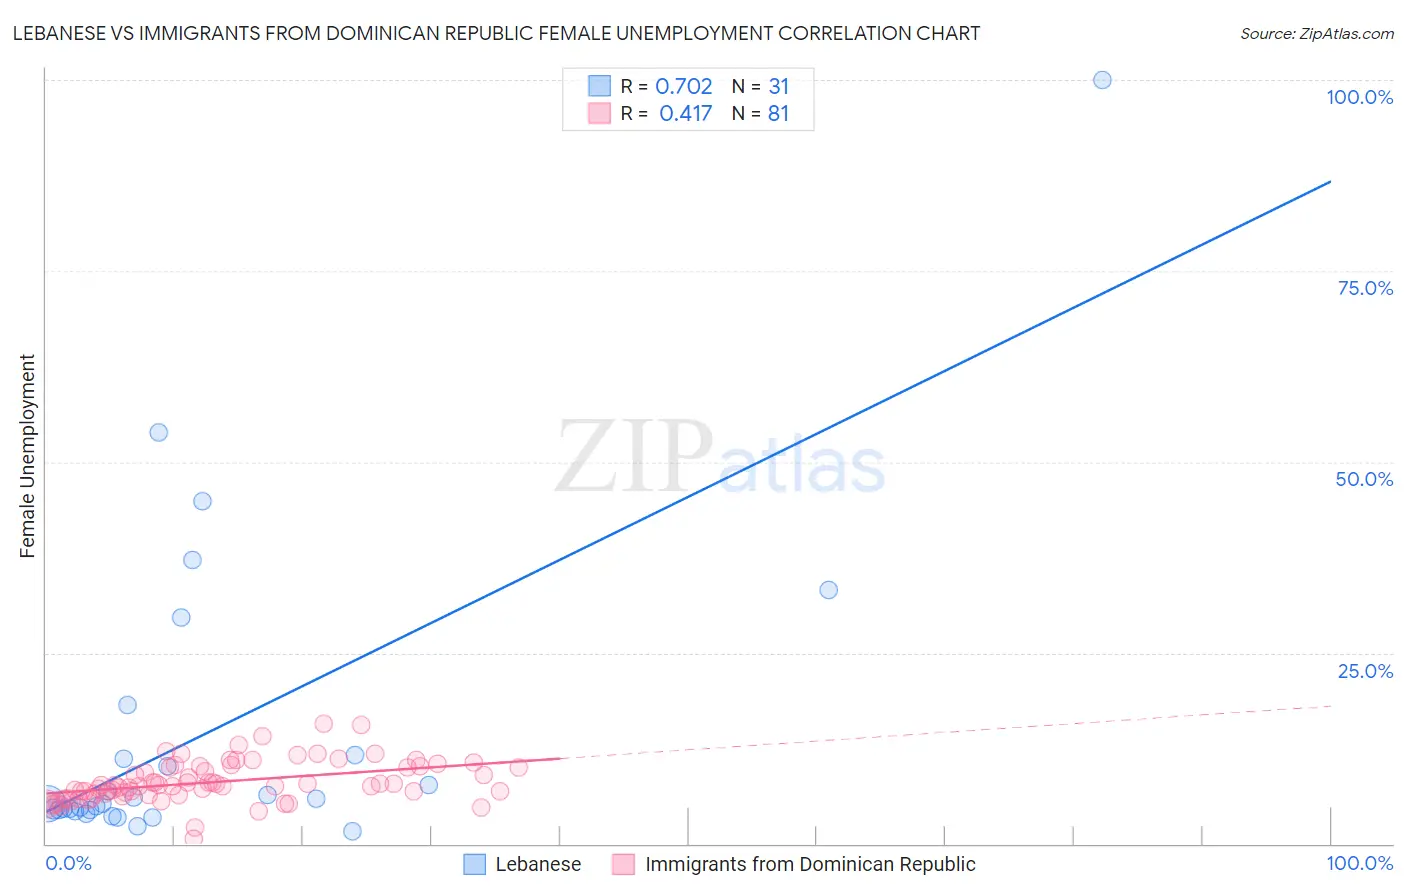
Lebanese vs Immigrants from Dominican Republic Female Unemployment Correlation Chart
The statistical analysis conducted on geographies consisting of 399,531,813 people shows a strong positive correlation between the proportion of Lebanese and unemploymnet rate among females in the United States with a correlation coefficient (R) of 0.702 and weighted average of 5.1%. Similarly, the statistical analysis conducted on geographies consisting of 274,282,461 people shows a moderate positive correlation between the proportion of Immigrants from Dominican Republic and unemploymnet rate among females in the United States with a correlation coefficient (R) of 0.417 and weighted average of 7.2%, a difference of 42.2%.
Female Unemployment Correlation Summary
| Measurement | Lebanese | Immigrants from Dominican Republic |
| Minimum | 1.6% | 0.70% |
| Maximum | 100.0% | 15.8% |
| Range | 98.4% | 15.1% |
| Mean | 14.5% | 8.1% |
| Median | 5.2% | 7.6% |
| Interquartile 25% (IQ1) | 4.4% | 6.4% |
| Interquartile 75% (IQ3) | 11.6% | 10.1% |
| Interquartile Range (IQR) | 7.2% | 3.7% |
| Standard Deviation (Sample) | 20.8% | 2.7% |
| Standard Deviation (Population) | 20.5% | 2.7% |
Similar Demographics by Female Unemployment
Demographics Similar to Lebanese by Female Unemployment
In terms of female unemployment, the demographic groups most similar to Lebanese are Immigrants from Turkey (5.1%, a difference of 0.020%), Immigrants from Saudi Arabia (5.1%, a difference of 0.050%), American (5.1%, a difference of 0.080%), Jordanian (5.1%, a difference of 0.12%), and Immigrants from Croatia (5.1%, a difference of 0.18%).
| Demographics | Rating | Rank | Female Unemployment |
| Puget Sound Salish | 93.0 /100 | #108 | Exceptional 5.1% |
| Immigrants | Eastern Africa | 92.8 /100 | #109 | Exceptional 5.1% |
| Macedonians | 92.4 /100 | #110 | Exceptional 5.1% |
| Immigrants | Burma/Myanmar | 92.3 /100 | #111 | Exceptional 5.1% |
| Estonians | 92.1 /100 | #112 | Exceptional 5.1% |
| Immigrants | Saudi Arabia | 91.2 /100 | #113 | Exceptional 5.1% |
| Immigrants | Turkey | 91.0 /100 | #114 | Exceptional 5.1% |
| Lebanese | 91.0 /100 | #115 | Exceptional 5.1% |
| Americans | 90.5 /100 | #116 | Exceptional 5.1% |
| Jordanians | 90.3 /100 | #117 | Exceptional 5.1% |
| Immigrants | Croatia | 89.9 /100 | #118 | Excellent 5.1% |
| Immigrants | North Macedonia | 88.3 /100 | #119 | Excellent 5.1% |
| Immigrants | Romania | 88.1 /100 | #120 | Excellent 5.1% |
| Immigrants | Western Europe | 88.1 /100 | #121 | Excellent 5.1% |
| Immigrants | Germany | 87.6 /100 | #122 | Excellent 5.1% |
Demographics Similar to Immigrants from Dominican Republic by Female Unemployment
In terms of female unemployment, the demographic groups most similar to Immigrants from Dominican Republic are Dominican (7.2%, a difference of 0.64%), Navajo (7.3%, a difference of 0.94%), Immigrants from Armenia (7.1%, a difference of 2.1%), Menominee (7.0%, a difference of 2.5%), and Sioux (7.0%, a difference of 2.5%).
| Demographics | Rating | Rank | Female Unemployment |
| Immigrants | Guyana | 0.0 /100 | #329 | Tragic 6.7% |
| Yakama | 0.0 /100 | #330 | Tragic 6.7% |
| Paiute | 0.0 /100 | #331 | Tragic 6.8% |
| Sioux | 0.0 /100 | #332 | Tragic 7.0% |
| Menominee | 0.0 /100 | #333 | Tragic 7.0% |
| Immigrants | Armenia | 0.0 /100 | #334 | Tragic 7.1% |
| Dominicans | 0.0 /100 | #335 | Tragic 7.2% |
| Immigrants | Dominican Republic | 0.0 /100 | #336 | Tragic 7.2% |
| Navajo | 0.0 /100 | #337 | Tragic 7.3% |
| Tohono O'odham | 0.0 /100 | #338 | Tragic 7.7% |
| Immigrants | Yemen | 0.0 /100 | #339 | Tragic 7.8% |
| Hopi | 0.0 /100 | #340 | Tragic 8.1% |
| Inupiat | 0.0 /100 | #341 | Tragic 8.2% |
| Puerto Ricans | 0.0 /100 | #342 | Tragic 8.3% |
| Arapaho | 0.0 /100 | #343 | Tragic 8.8% |