Laotian vs Immigrants from Guyana Unemployment Among Seniors over 75 years
COMPARE
Laotian
Immigrants from Guyana
Unemployment Among Seniors over 75 years
Unemployment Among Seniors over 75 years Comparison
Laotians
Immigrants from Guyana
8.2%
UNEMPLOYMENT AMONG SENIORS OVER 75 YEARS
98.8/ 100
METRIC RATING
108th/ 347
METRIC RANK
8.8%
UNEMPLOYMENT AMONG SENIORS OVER 75 YEARS
29.9/ 100
METRIC RATING
193rd/ 347
METRIC RANK
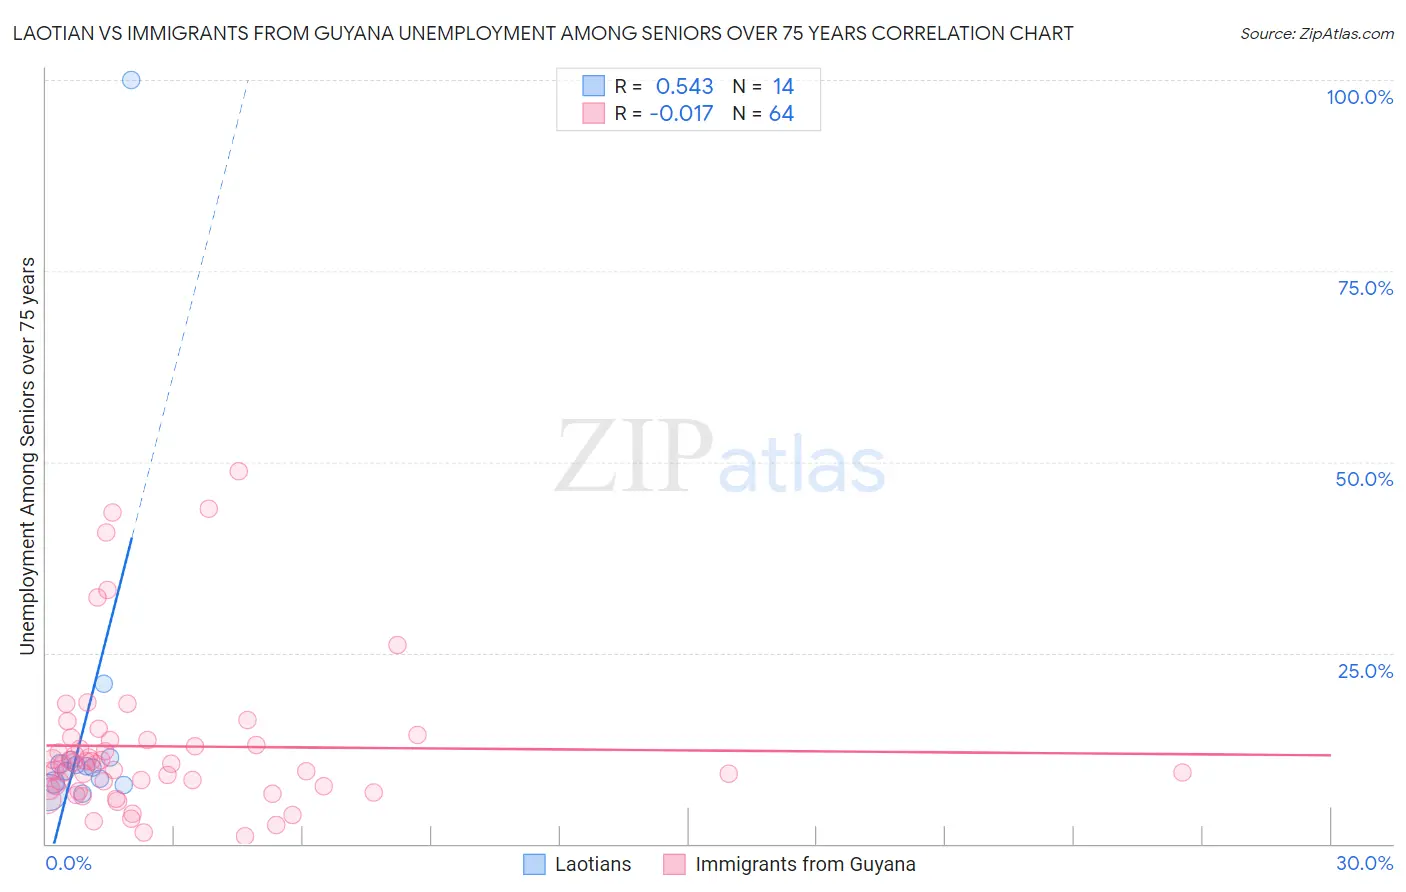
Laotian vs Immigrants from Guyana Unemployment Among Seniors over 75 years Correlation Chart
The statistical analysis conducted on geographies consisting of 143,496,387 people shows a substantial positive correlation between the proportion of Laotians and unemployment rate among seniors over the age of 75 in the United States with a correlation coefficient (R) of 0.543 and weighted average of 8.2%. Similarly, the statistical analysis conducted on geographies consisting of 117,930,233 people shows no correlation between the proportion of Immigrants from Guyana and unemployment rate among seniors over the age of 75 in the United States with a correlation coefficient (R) of -0.017 and weighted average of 8.8%, a difference of 7.5%.
Unemployment Among Seniors over 75 years Correlation Summary
| Measurement | Laotian | Immigrants from Guyana |
| Minimum | 6.5% | 1.0% |
| Maximum | 100.0% | 48.7% |
| Range | 93.5% | 47.7% |
| Mean | 16.5% | 12.8% |
| Median | 10.1% | 10.4% |
| Interquartile 25% (IQ1) | 8.1% | 7.3% |
| Interquartile 75% (IQ3) | 11.0% | 13.6% |
| Interquartile Range (IQR) | 3.0% | 6.2% |
| Standard Deviation (Sample) | 24.3% | 10.1% |
| Standard Deviation (Population) | 23.4% | 10.1% |
Similar Demographics by Unemployment Among Seniors over 75 years
Demographics Similar to Laotians by Unemployment Among Seniors over 75 years
In terms of unemployment among seniors over 75 years, the demographic groups most similar to Laotians are Immigrants from Lebanon (8.2%, a difference of 0.020%), Marshallese (8.2%, a difference of 0.050%), French American Indian (8.2%, a difference of 0.10%), Sri Lankan (8.2%, a difference of 0.13%), and Immigrants from India (8.2%, a difference of 0.22%).
| Demographics | Rating | Rank | Unemployment Among Seniors over 75 years |
| Immigrants | Serbia | 99.2 /100 | #101 | Exceptional 8.2% |
| Immigrants | Panama | 99.1 /100 | #102 | Exceptional 8.2% |
| South American Indians | 99.1 /100 | #103 | Exceptional 8.2% |
| Immigrants | South Central Asia | 99.0 /100 | #104 | Exceptional 8.2% |
| Immigrants | Caribbean | 99.0 /100 | #105 | Exceptional 8.2% |
| Immigrants | Honduras | 99.0 /100 | #106 | Exceptional 8.2% |
| Sri Lankans | 98.9 /100 | #107 | Exceptional 8.2% |
| Laotians | 98.8 /100 | #108 | Exceptional 8.2% |
| Immigrants | Lebanon | 98.8 /100 | #109 | Exceptional 8.2% |
| Marshallese | 98.7 /100 | #110 | Exceptional 8.2% |
| French American Indians | 98.7 /100 | #111 | Exceptional 8.2% |
| Immigrants | India | 98.6 /100 | #112 | Exceptional 8.2% |
| Asians | 98.5 /100 | #113 | Exceptional 8.3% |
| Trinidadians and Tobagonians | 98.4 /100 | #114 | Exceptional 8.3% |
| Sudanese | 98.2 /100 | #115 | Exceptional 8.3% |
Demographics Similar to Immigrants from Guyana by Unemployment Among Seniors over 75 years
In terms of unemployment among seniors over 75 years, the demographic groups most similar to Immigrants from Guyana are Maltese (8.8%, a difference of 0.050%), Okinawan (8.8%, a difference of 0.070%), Immigrants from Kenya (8.8%, a difference of 0.12%), Immigrants from Jamaica (8.9%, a difference of 0.14%), and Estonian (8.8%, a difference of 0.20%).
| Demographics | Rating | Rank | Unemployment Among Seniors over 75 years |
| Immigrants | Ethiopia | 36.2 /100 | #186 | Fair 8.8% |
| Immigrants | Europe | 35.2 /100 | #187 | Fair 8.8% |
| Immigrants | Eastern Europe | 34.7 /100 | #188 | Fair 8.8% |
| Immigrants | Haiti | 34.7 /100 | #189 | Fair 8.8% |
| Mexican American Indians | 34.7 /100 | #190 | Fair 8.8% |
| Estonians | 33.3 /100 | #191 | Fair 8.8% |
| Immigrants | Kenya | 31.8 /100 | #192 | Fair 8.8% |
| Immigrants | Guyana | 29.9 /100 | #193 | Fair 8.8% |
| Maltese | 29.2 /100 | #194 | Fair 8.8% |
| Okinawans | 28.9 /100 | #195 | Fair 8.8% |
| Immigrants | Jamaica | 27.7 /100 | #196 | Fair 8.9% |
| Immigrants | Laos | 26.3 /100 | #197 | Fair 8.9% |
| Eastern Europeans | 25.9 /100 | #198 | Fair 8.9% |
| Pakistanis | 25.4 /100 | #199 | Fair 8.9% |
| Osage | 25.4 /100 | #200 | Fair 8.9% |