Laotian vs Danish Unemployment Among Women with Children Ages 6 to 17 years
COMPARE
Laotian
Danish
Unemployment Among Women with Children Ages 6 to 17 years
Unemployment Among Women with Children Ages 6 to 17 years Comparison
Laotians
Danes
7.9%
UNEMPLOYMENT AMONG WOMEN WITH CHILDREN AGES 6 TO 17 YEARS
100.0/ 100
METRIC RATING
31st/ 347
METRIC RANK
8.1%
UNEMPLOYMENT AMONG WOMEN WITH CHILDREN AGES 6 TO 17 YEARS
100.0/ 100
METRIC RATING
53rd/ 347
METRIC RANK
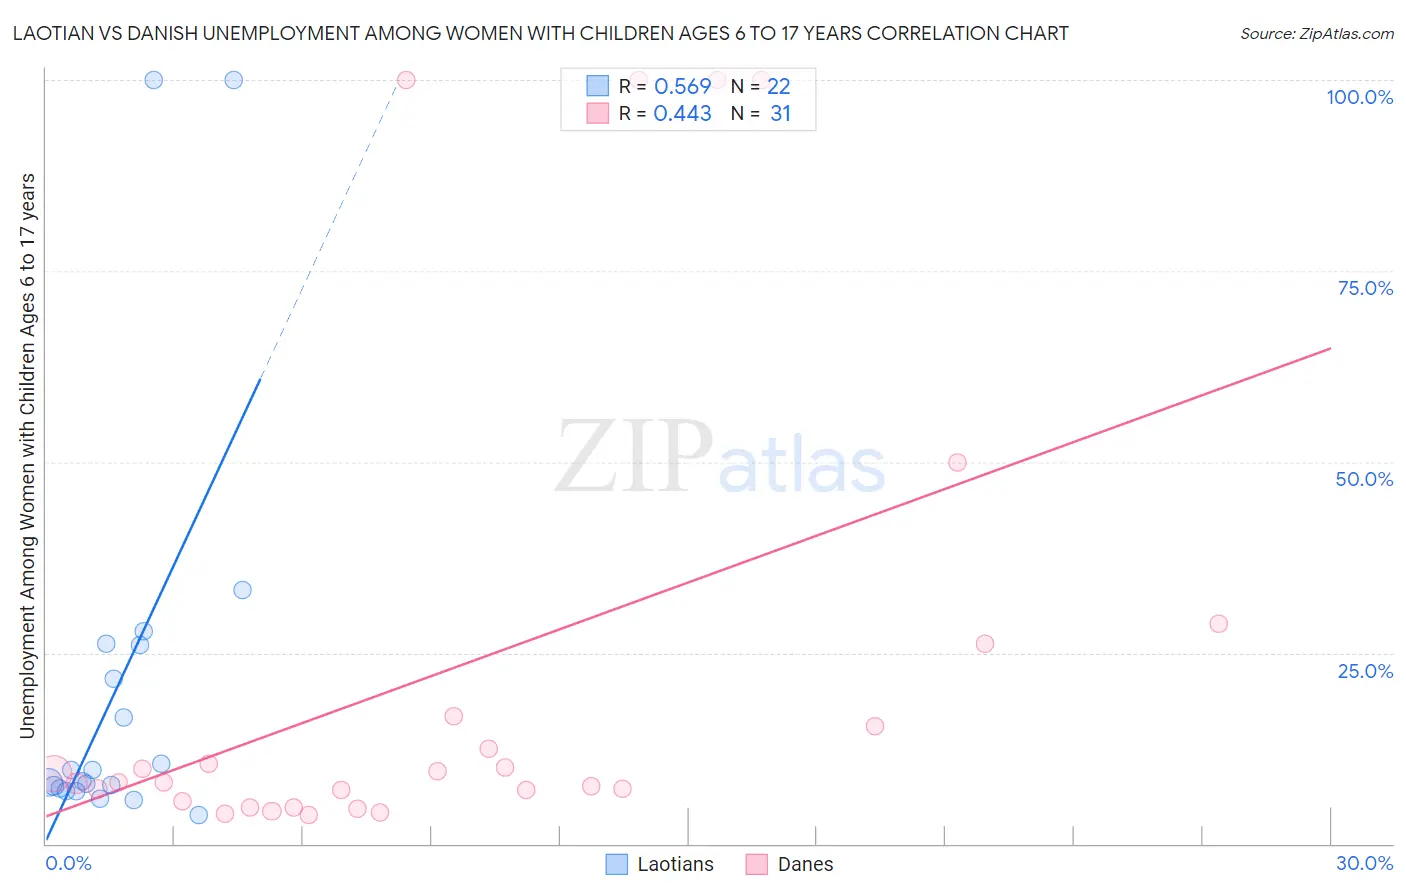
Laotian vs Danish Unemployment Among Women with Children Ages 6 to 17 years Correlation Chart
The statistical analysis conducted on geographies consisting of 181,430,128 people shows a substantial positive correlation between the proportion of Laotians and unemployment rate among women with children between the ages 6 and 17 in the United States with a correlation coefficient (R) of 0.569 and weighted average of 7.9%. Similarly, the statistical analysis conducted on geographies consisting of 314,028,244 people shows a moderate positive correlation between the proportion of Danes and unemployment rate among women with children between the ages 6 and 17 in the United States with a correlation coefficient (R) of 0.443 and weighted average of 8.1%, a difference of 2.9%.
Unemployment Among Women with Children Ages 6 to 17 years Correlation Summary
| Measurement | Laotian | Danish |
| Minimum | 3.7% | 3.8% |
| Maximum | 100.0% | 100.0% |
| Range | 96.3% | 96.2% |
| Mean | 20.8% | 22.4% |
| Median | 8.9% | 8.1% |
| Interquartile 25% (IQ1) | 7.2% | 5.5% |
| Interquartile 75% (IQ3) | 26.1% | 16.7% |
| Interquartile Range (IQR) | 18.9% | 11.2% |
| Standard Deviation (Sample) | 27.0% | 31.7% |
| Standard Deviation (Population) | 26.4% | 31.2% |
Similar Demographics by Unemployment Among Women with Children Ages 6 to 17 years
Demographics Similar to Laotians by Unemployment Among Women with Children Ages 6 to 17 years
In terms of unemployment among women with children ages 6 to 17 years, the demographic groups most similar to Laotians are Immigrants from Cambodia (7.9%, a difference of 0.050%), Immigrants from Korea (7.9%, a difference of 0.11%), Immigrants from Iran (7.9%, a difference of 0.19%), Native Hawaiian (7.9%, a difference of 0.39%), and Immigrants from South Central Asia (7.9%, a difference of 0.50%).
| Demographics | Rating | Rank | Unemployment Among Women with Children Ages 6 to 17 years |
| Nepalese | 100.0 /100 | #24 | Exceptional 7.7% |
| Immigrants | Eastern Asia | 100.0 /100 | #25 | Exceptional 7.7% |
| Indians (Asian) | 100.0 /100 | #26 | Exceptional 7.7% |
| Immigrants | Afghanistan | 100.0 /100 | #27 | Exceptional 7.8% |
| Immigrants | Uzbekistan | 100.0 /100 | #28 | Exceptional 7.8% |
| Thais | 100.0 /100 | #29 | Exceptional 7.8% |
| Immigrants | Iran | 100.0 /100 | #30 | Exceptional 7.9% |
| Laotians | 100.0 /100 | #31 | Exceptional 7.9% |
| Immigrants | Cambodia | 100.0 /100 | #32 | Exceptional 7.9% |
| Immigrants | Korea | 100.0 /100 | #33 | Exceptional 7.9% |
| Native Hawaiians | 100.0 /100 | #34 | Exceptional 7.9% |
| Immigrants | South Central Asia | 100.0 /100 | #35 | Exceptional 7.9% |
| Burmese | 100.0 /100 | #36 | Exceptional 8.0% |
| Asians | 100.0 /100 | #37 | Exceptional 8.0% |
| Alsatians | 100.0 /100 | #38 | Exceptional 8.0% |
Demographics Similar to Danes by Unemployment Among Women with Children Ages 6 to 17 years
In terms of unemployment among women with children ages 6 to 17 years, the demographic groups most similar to Danes are Immigrants from Iraq (8.1%, a difference of 0.060%), Immigrants from Armenia (8.2%, a difference of 0.22%), Immigrants from Japan (8.2%, a difference of 0.29%), Immigrants from Bosnia and Herzegovina (8.2%, a difference of 0.30%), and Immigrants from Laos (8.2%, a difference of 0.32%).
| Demographics | Rating | Rank | Unemployment Among Women with Children Ages 6 to 17 years |
| Icelanders | 100.0 /100 | #46 | Exceptional 8.1% |
| Immigrants | Switzerland | 100.0 /100 | #47 | Exceptional 8.1% |
| Immigrants | Asia | 100.0 /100 | #48 | Exceptional 8.1% |
| Immigrants | Oceania | 100.0 /100 | #49 | Exceptional 8.1% |
| Hawaiians | 100.0 /100 | #50 | Exceptional 8.1% |
| Immigrants | Sudan | 100.0 /100 | #51 | Exceptional 8.1% |
| Immigrants | Iraq | 100.0 /100 | #52 | Exceptional 8.1% |
| Danes | 100.0 /100 | #53 | Exceptional 8.1% |
| Immigrants | Armenia | 100.0 /100 | #54 | Exceptional 8.2% |
| Immigrants | Japan | 100.0 /100 | #55 | Exceptional 8.2% |
| Immigrants | Bosnia and Herzegovina | 100.0 /100 | #56 | Exceptional 8.2% |
| Immigrants | Laos | 100.0 /100 | #57 | Exceptional 8.2% |
| Immigrants | Malaysia | 100.0 /100 | #58 | Exceptional 8.2% |
| Immigrants | Philippines | 100.0 /100 | #59 | Exceptional 8.2% |
| Basques | 100.0 /100 | #60 | Exceptional 8.2% |