Korean vs Yuman Unemployment Among Ages 60 to 64 years

COMPARE

Korean
Race
Ancestry
AfghanAfricanAlaska NativeAlaskan AthabascanAlbanianAleutAlsatianAmericanApacheArabArapahoArgentineanArmenianAssyrian/Chaldean/SyriacAustralianAustrianBahamianBangladeshiBarbadianBasqueBelgianBelizeanBermudanBhutaneseBlackfeetBolivianBrazilianBritishBritish West IndianBulgarianBurmeseCajunCambodianCanadianCape VerdeanCarpatho RusynCelticCentral AmericanCentral American IndianCherokeeCheyenneChickasawChileanChineseChippewaChoctawColombianColvilleComancheCosta RicanCreeCreekCroatianCrowCubanCypriotCzechCzechoslovakianDanishDelawareDominicanDutchDutch West IndianEastern EuropeanEcuadorianEgyptianEnglishEstonianEthiopianEuropeanFijianFilipinoFinnishFrenchFrench American IndianFrench CanadianGermanGerman RussianGhanaianGreekGuamanian/ChamorroGuatemalanGuyaneseHaitianHmongHonduranHopiHoumaHungarianIcelanderIndian (Asian)IndonesianInupiatIranianIraqiIrishIroquoisIsraeliItalianJamaicanJapaneseJordanianKenyanKiowaKoreanLaotianLatvianLebaneseLiberianLithuanianLumbeeLuxembourgerMacedonianMalaysianMalteseMarshalleseMenomineeMexicanMexican American IndianMongolianMoroccanNative HawaiianNavajoNepaleseNew ZealanderNicaraguanNigerianNorthern EuropeanNorwegianOkinawanOsageOttawaPaiutePakistaniPalestinianPanamanianParaguayanPennsylvania GermanPeruvianPimaPolishPortuguesePotawatomiPuebloPuerto RicanPuget Sound SalishRomanianRussianSalvadoranSamoanScandinavianScotch-IrishScottishSeminoleSenegaleseSerbianShoshoneSierra LeoneanSiouxSlavicSlovakSloveneSomaliSouth AfricanSouth AmericanSouth American IndianSoviet UnionSpaniardSpanishSpanish AmericanSpanish American IndianSri LankanSubsaharan AfricanSudaneseSwedishSwissSyrianTaiwaneseThaiTlingit-HaidaTohono O'OdhamTonganTrinidadian and TobagonianTsimshianTurkishU.S. Virgin IslanderUgandanUkrainianUruguayanUteVenezuelanVietnameseWelshWest IndianYakamaYaquiYugoslavianYup'ikZimbabwean
Immigration
NonimmigrantsImmigrantsAfghanistanAfricaAlbaniaArgentinaArmeniaAsiaAustraliaAustriaBahamasBangladeshBarbadosBelarusBelgiumBelizeBoliviaBosnia and HerzegovinaBrazilBulgariaBurma/MyanmarCabo VerdeCambodiaCameroonCanadaCaribbeanCentral AmericaChileChinaColombiaCongoCosta RicaCroatiaCubaCzechoslovakiaDenmarkDominicaDominican RepublicEastern AfricaEastern AsiaEastern EuropeEcuadorEgyptEl SalvadorEnglandEritreaEthiopiaEuropeFijiFranceGermanyGhanaGreeceGrenadaGuatemalaGuyanaHaitiHondurasHong KongHungaryIndiaIndonesiaIranIraqIrelandIsraelItalyJamaicaJapanJordanKazakhstanKenyaKoreaKuwaitLaosLatin AmericaLatviaLebanonLiberiaLithuaniaMalaysiaMexicoMicronesiaMiddle AfricaMoldovaMoroccoNepalNetherlandsNicaraguaNigeriaNorth AmericaNorth MacedoniaNorthern AfricaNorthern EuropeNorwayOceaniaPakistanPanamaPeruPhilippinesPolandPortugalRomaniaRussiaSaudi ArabiaScotlandSenegalSerbiaSierra LeoneSingaporeSomaliaSouth AfricaSouth AmericaSouth Central AsiaSouth Eastern AsiaSouthern EuropeSpainSri LankaSt. Vincent and the GrenadinesSudanSwedenSwitzerlandSyriaTaiwanThailandTrinidad and TobagoTurkeyUgandaUkraineUruguayUzbekistanVenezuelaVietnamWest IndiesWestern AfricaWestern AsiaWestern EuropeYemenZaireZimbabweAzores
Yuman
Race
Ancestry
AfghanAfricanAlaska NativeAlaskan AthabascanAlbanianAleutAlsatianAmericanApacheArabArapahoArgentineanArmenianAssyrian/Chaldean/SyriacAustralianAustrianBahamianBangladeshiBarbadianBasqueBelgianBelizeanBermudanBhutaneseBlackfeetBolivianBrazilianBritishBritish West IndianBulgarianBurmeseCajunCambodianCanadianCape VerdeanCarpatho RusynCelticCentral AmericanCentral American IndianCherokeeCheyenneChickasawChileanChineseChippewaChoctawColombianColvilleComancheCosta RicanCreeCreekCroatianCrowCubanCypriotCzechCzechoslovakianDanishDelawareDominicanDutchDutch West IndianEastern EuropeanEcuadorianEgyptianEnglishEstonianEthiopianEuropeanFijianFilipinoFinnishFrenchFrench American IndianFrench CanadianGermanGerman RussianGhanaianGreekGuamanian/ChamorroGuatemalanGuyaneseHaitianHmongHonduranHopiHoumaHungarianIcelanderIndian (Asian)IndonesianInupiatIranianIraqiIrishIroquoisIsraeliItalianJamaicanJapaneseJordanianKenyanKiowaLaotianLatvianLebaneseLiberianLithuanianLumbeeLuxembourgerMacedonianMalaysianMalteseMarshalleseMenomineeMexicanMexican American IndianMongolianMoroccanNative HawaiianNavajoNepaleseNew ZealanderNicaraguanNigerianNorthern EuropeanNorwegianOkinawanOsageOttawaPaiutePakistaniPalestinianPanamanianParaguayanPennsylvania GermanPeruvianPimaPolishPortuguesePotawatomiPuebloPuerto RicanPuget Sound SalishRomanianRussianSalvadoranSamoanScandinavianScotch-IrishScottishSeminoleSenegaleseSerbianShoshoneSierra LeoneanSiouxSlavicSlovakSloveneSomaliSouth AfricanSouth AmericanSouth American IndianSoviet UnionSpaniardSpanishSpanish AmericanSpanish American IndianSri LankanSubsaharan AfricanSudaneseSwedishSwissSyrianTaiwaneseThaiTlingit-HaidaTohono O'OdhamTonganTrinidadian and TobagonianTsimshianTurkishU.S. Virgin IslanderUgandanUkrainianUruguayanUteVenezuelanVietnameseWelshWest IndianYakamaYaquiYugoslavianYumanYup'ikZimbabwean
Immigration
NonimmigrantsImmigrantsAfghanistanAfricaAlbaniaArgentinaArmeniaAsiaAustraliaAustriaBahamasBangladeshBarbadosBelarusBelgiumBelizeBoliviaBosnia and HerzegovinaBrazilBulgariaBurma/MyanmarCabo VerdeCambodiaCameroonCanadaCaribbeanCentral AmericaChileChinaColombiaCongoCosta RicaCroatiaCubaCzechoslovakiaDenmarkDominicaDominican RepublicEastern AfricaEastern AsiaEastern EuropeEcuadorEgyptEl SalvadorEnglandEritreaEthiopiaEuropeFijiFranceGermanyGhanaGreeceGrenadaGuatemalaGuyanaHaitiHondurasHong KongHungaryIndiaIndonesiaIranIraqIrelandIsraelItalyJamaicaJapanJordanKazakhstanKenyaKoreaKuwaitLaosLatin AmericaLatviaLebanonLiberiaLithuaniaMalaysiaMexicoMicronesiaMiddle AfricaMoldovaMoroccoNepalNetherlandsNicaraguaNigeriaNorth AmericaNorth MacedoniaNorthern AfricaNorthern EuropeNorwayOceaniaPakistanPanamaPeruPhilippinesPolandPortugalRomaniaRussiaSaudi ArabiaScotlandSenegalSerbiaSierra LeoneSingaporeSomaliaSouth AfricaSouth AmericaSouth Central AsiaSouth Eastern AsiaSouthern EuropeSpainSri LankaSt. Vincent and the GrenadinesSudanSwedenSwitzerlandSyriaTaiwanThailandTrinidad and TobagoTurkeyUgandaUkraineUruguayUzbekistanVenezuelaVietnamWest IndiesWestern AfricaWestern AsiaWestern EuropeYemenZaireZimbabweAzores
Unemployment Among Ages 60 to 64 years
Income
Poverty
Unemployment
Labor Participation
Family Structure
Vehicle Availability
Education Level
Disability

Unemployment Among Ages 60 to 64 years Comparison

Koreans

Yuman

Poor
Tragic
4.9%
UNEMPLOYMENT AMONG AGES 60 TO 64 YEARS
12.2/ 100
METRIC RATING
217th/ 347
METRIC RANK
6.8%
UNEMPLOYMENT AMONG AGES 60 TO 64 YEARS
0.0/ 100
METRIC RATING
341st/ 347
METRIC RANK

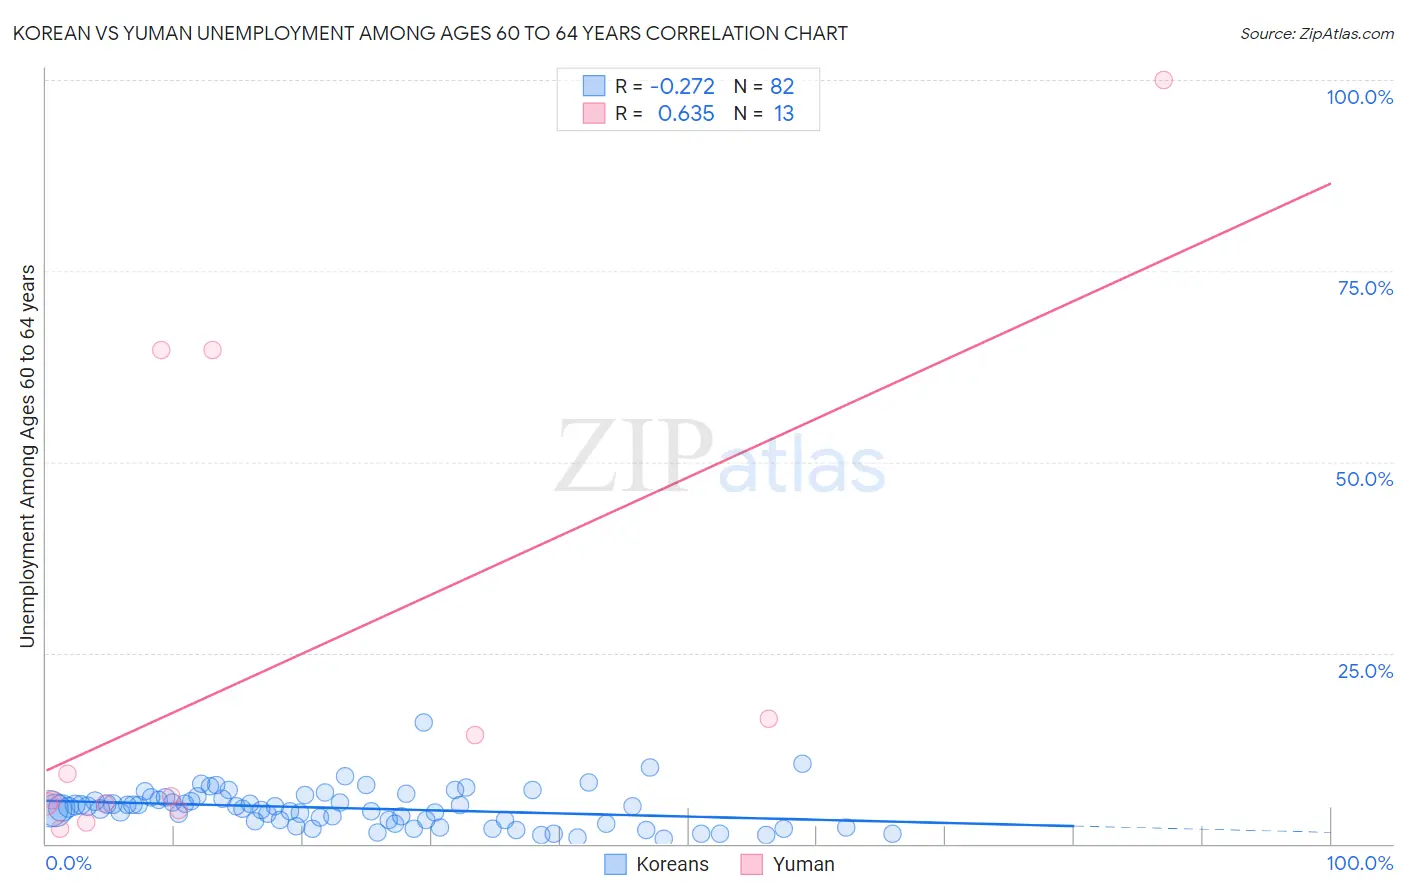
Korean vs Yuman Unemployment Among Ages 60 to 64 years Correlation Chart

The statistical analysis conducted on geographies consisting of 440,560,211 people shows a weak negative correlation between the proportion of Koreans and unemployment rate among population between the ages 60 and 64 in the United States with a correlation coefficient (R) of -0.272 and weighted average of 4.9%. Similarly, the statistical analysis conducted on geographies consisting of 39,921,658 people shows a significant positive correlation between the proportion of Yuman and unemployment rate among population between the ages 60 and 64 in the United States with a correlation coefficient (R) of 0.635 and weighted average of 6.8%, a difference of 37.1%.
Korean vs Yuman Unemployment Among Ages 60 to 64 years

Unemployment Among Ages 60 to 64 years Correlation Summary

MeasurementKoreanYuman
Minimum0.60%2.0%
Maximum15.8%100.0%
Range15.2%98.0%
Mean4.7%23.1%
Median4.8%6.2%
Interquartile 25% (IQ1)3.0%4.8%
Interquartile 75% (IQ3)6.0%40.5%
Interquartile Range (IQR)3.0%35.8%
Standard Deviation (Sample)2.5%31.8%
Standard Deviation (Population)2.5%30.5%

Similar Demographics by Unemployment Among Ages 60 to 64 years

Demographics Similar to Koreans by Unemployment Among Ages 60 to 64 years

In terms of unemployment among ages 60 to 64 years, the demographic groups most similar to Koreans are Cajun (4.9%, a difference of 0.010%), Immigrants from Singapore (4.9%, a difference of 0.010%), Immigrants from Brazil (4.9%, a difference of 0.040%), Ottawa (4.9%, a difference of 0.050%), and Immigrants from South Eastern Asia (4.9%, a difference of 0.070%).
DemographicsRating | RankUnemployment Among Ages 60 to 64 years
Cherokee
16.1
/100
|
#210
Poor
4.9%
Blackfeet
15.7
/100
|
#211
Poor
4.9%
Moroccans
15.0
/100
|
#212
Poor
4.9%
Eastern Europeans
14.3
/100
|
#213
Poor
4.9%
Immigrants | Russia
13.7
/100
|
#214
Poor
4.9%
Immigrants | South Eastern Asia
13.1
/100
|
#215
Poor
4.9%
Cajuns
12.3
/100
|
#216
Poor
4.9%
Koreans
12.2
/100
|
#217
Poor
4.9%
Immigrants | Singapore
12.0
/100
|
#218
Poor
4.9%
Immigrants | Brazil
11.7
/100
|
#219
Poor
4.9%
Ottawa
11.6
/100
|
#220
Poor
4.9%
Ugandans
10.5
/100
|
#221
Poor
4.9%
Brazilians
10.1
/100
|
#222
Poor
5.0%
Crow
9.7
/100
|
#223
Tragic
5.0%
Immigrants | Cameroon
8.5
/100
|
#224
Tragic
5.0%

Demographics Similar to Yuman by Unemployment Among Ages 60 to 64 years

In terms of unemployment among ages 60 to 64 years, the demographic groups most similar to Yuman are Aleut (6.8%, a difference of 0.010%), Pueblo (6.7%, a difference of 0.53%), Immigrants from Yemen (6.8%, a difference of 0.73%), Tlingit-Haida (6.4%, a difference of 6.1%), and Arapaho (6.3%, a difference of 7.6%).
DemographicsRating | RankUnemployment Among Ages 60 to 64 years
Immigrants | Dominican Republic
0.0
/100
|
#333
Tragic
6.0%
Puerto Ricans
0.0
/100
|
#334
Tragic
6.1%
Vietnamese
0.0
/100
|
#335
Tragic
6.1%
Kiowa
0.0
/100
|
#336
Tragic
6.2%
Navajo
0.0
/100
|
#337
Tragic
6.3%
Arapaho
0.0
/100
|
#338
Tragic
6.3%
Tlingit-Haida
0.0
/100
|
#339
Tragic
6.4%
Pueblo
0.0
/100
|
#340
Tragic
6.7%
Yuman
0.0
/100
|
#341
Tragic
6.8%
Aleuts
0.0
/100
|
#342
Tragic
6.8%
Immigrants | Yemen
0.0
/100
|
#343
Tragic
6.8%
Alaska Natives
0.0
/100
|
#344
Tragic
7.6%
Alaskan Athabascans
0.0
/100
|
#345
Tragic
8.4%
Inupiat
0.0
/100
|
#346
Tragic
9.6%
Yup'ik
0.0
/100
|
#347
Tragic
11.9%