Korean vs Menominee Unemployment Among Ages 45 to 54 years
COMPARE
Korean
Menominee
Unemployment Among Ages 45 to 54 years
Unemployment Among Ages 45 to 54 years Comparison
Koreans
Menominee
4.5%
UNEMPLOYMENT AMONG AGES 45 TO 54 YEARS
73.1/ 100
METRIC RATING
152nd/ 347
METRIC RANK
5.3%
UNEMPLOYMENT AMONG AGES 45 TO 54 YEARS
0.0/ 100
METRIC RATING
301st/ 347
METRIC RANK
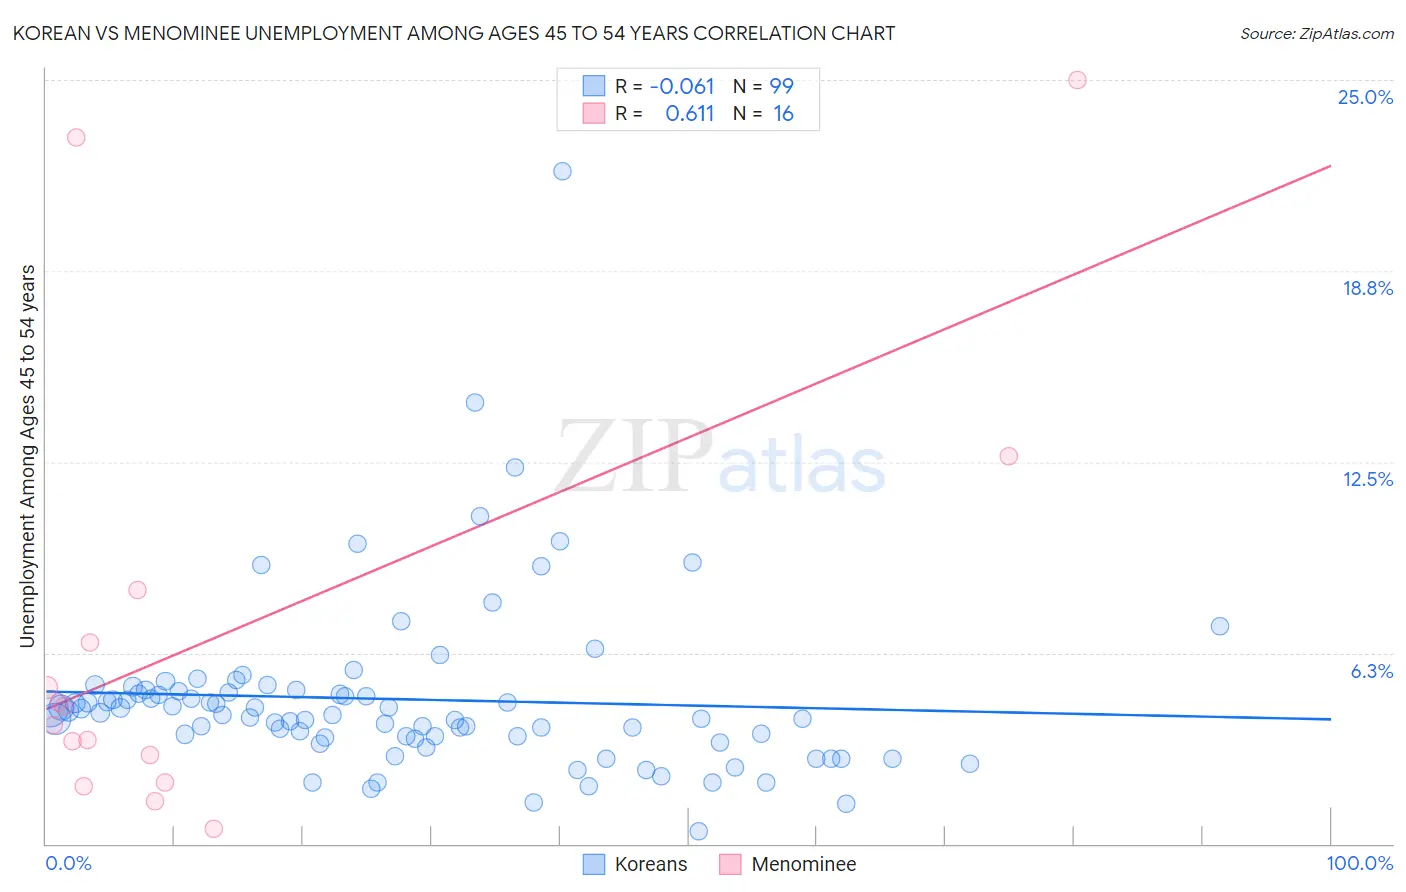
Korean vs Menominee Unemployment Among Ages 45 to 54 years Correlation Chart
The statistical analysis conducted on geographies consisting of 488,206,822 people shows a slight negative correlation between the proportion of Koreans and unemployment rate among population between the ages 45 and 54 in the United States with a correlation coefficient (R) of -0.061 and weighted average of 4.5%. Similarly, the statistical analysis conducted on geographies consisting of 45,287,300 people shows a significant positive correlation between the proportion of Menominee and unemployment rate among population between the ages 45 and 54 in the United States with a correlation coefficient (R) of 0.611 and weighted average of 5.3%, a difference of 18.5%.
Unemployment Among Ages 45 to 54 years Correlation Summary
| Measurement | Korean | Menominee |
| Minimum | 0.40% | 0.50% |
| Maximum | 22.0% | 25.0% |
| Range | 21.6% | 24.5% |
| Mean | 4.7% | 6.8% |
| Median | 4.3% | 4.2% |
| Interquartile 25% (IQ1) | 3.5% | 2.5% |
| Interquartile 75% (IQ3) | 5.0% | 7.4% |
| Interquartile Range (IQR) | 1.5% | 5.0% |
| Standard Deviation (Sample) | 2.8% | 7.3% |
| Standard Deviation (Population) | 2.8% | 7.1% |
Similar Demographics by Unemployment Among Ages 45 to 54 years
Demographics Similar to Koreans by Unemployment Among Ages 45 to 54 years
In terms of unemployment among ages 45 to 54 years, the demographic groups most similar to Koreans are Hungarian (4.5%, a difference of 0.010%), Immigrants from Spain (4.5%, a difference of 0.030%), Cypriot (4.5%, a difference of 0.080%), Tsimshian (4.5%, a difference of 0.10%), and Immigrants from Austria (4.5%, a difference of 0.14%).
| Demographics | Rating | Rank | Unemployment Among Ages 45 to 54 years |
| Immigrants | Latvia | 77.5 /100 | #145 | Good 4.5% |
| Syrians | 77.3 /100 | #146 | Good 4.5% |
| Uruguayans | 76.9 /100 | #147 | Good 4.5% |
| Immigrants | Austria | 75.3 /100 | #148 | Good 4.5% |
| Costa Ricans | 75.3 /100 | #149 | Good 4.5% |
| Tsimshian | 74.6 /100 | #150 | Good 4.5% |
| Cypriots | 74.4 /100 | #151 | Good 4.5% |
| Koreans | 73.1 /100 | #152 | Good 4.5% |
| Hungarians | 73.0 /100 | #153 | Good 4.5% |
| Immigrants | Spain | 72.5 /100 | #154 | Good 4.5% |
| Marshallese | 70.6 /100 | #155 | Good 4.5% |
| Immigrants | Croatia | 69.6 /100 | #156 | Good 4.5% |
| Indians (Asian) | 68.1 /100 | #157 | Good 4.5% |
| Immigrants | Italy | 65.5 /100 | #158 | Good 4.5% |
| Immigrants | Nonimmigrants | 62.8 /100 | #159 | Good 4.5% |
Demographics Similar to Menominee by Unemployment Among Ages 45 to 54 years
In terms of unemployment among ages 45 to 54 years, the demographic groups most similar to Menominee are Central American Indian (5.3%, a difference of 0.21%), Ecuadorian (5.3%, a difference of 0.42%), Immigrants from Trinidad and Tobago (5.3%, a difference of 0.44%), Aleut (5.3%, a difference of 0.56%), and West Indian (5.3%, a difference of 0.56%).
| Demographics | Rating | Rank | Unemployment Among Ages 45 to 54 years |
| Belizeans | 0.0 /100 | #294 | Tragic 5.2% |
| Jamaicans | 0.0 /100 | #295 | Tragic 5.3% |
| Aleuts | 0.0 /100 | #296 | Tragic 5.3% |
| West Indians | 0.0 /100 | #297 | Tragic 5.3% |
| Immigrants | Trinidad and Tobago | 0.0 /100 | #298 | Tragic 5.3% |
| Ecuadorians | 0.0 /100 | #299 | Tragic 5.3% |
| Central American Indians | 0.0 /100 | #300 | Tragic 5.3% |
| Menominee | 0.0 /100 | #301 | Tragic 5.3% |
| Immigrants | Ecuador | 0.0 /100 | #302 | Tragic 5.3% |
| Immigrants | Belize | 0.0 /100 | #303 | Tragic 5.3% |
| Immigrants | Jamaica | 0.0 /100 | #304 | Tragic 5.4% |
| Immigrants | West Indies | 0.0 /100 | #305 | Tragic 5.4% |
| Immigrants | Bangladesh | 0.0 /100 | #306 | Tragic 5.4% |
| Vietnamese | 0.0 /100 | #307 | Tragic 5.4% |
| Blacks/African Americans | 0.0 /100 | #308 | Tragic 5.4% |