Korean vs Immigrants from Bahamas Unemployment Among Seniors over 75 years
COMPARE
Korean
Immigrants from Bahamas
Unemployment Among Seniors over 75 years
Unemployment Among Seniors over 75 years Comparison
Koreans
Immigrants from Bahamas
8.9%
UNEMPLOYMENT AMONG SENIORS OVER 75 YEARS
21.9/ 100
METRIC RATING
205th/ 347
METRIC RANK
8.6%
UNEMPLOYMENT AMONG SENIORS OVER 75 YEARS
76.5/ 100
METRIC RATING
156th/ 347
METRIC RANK
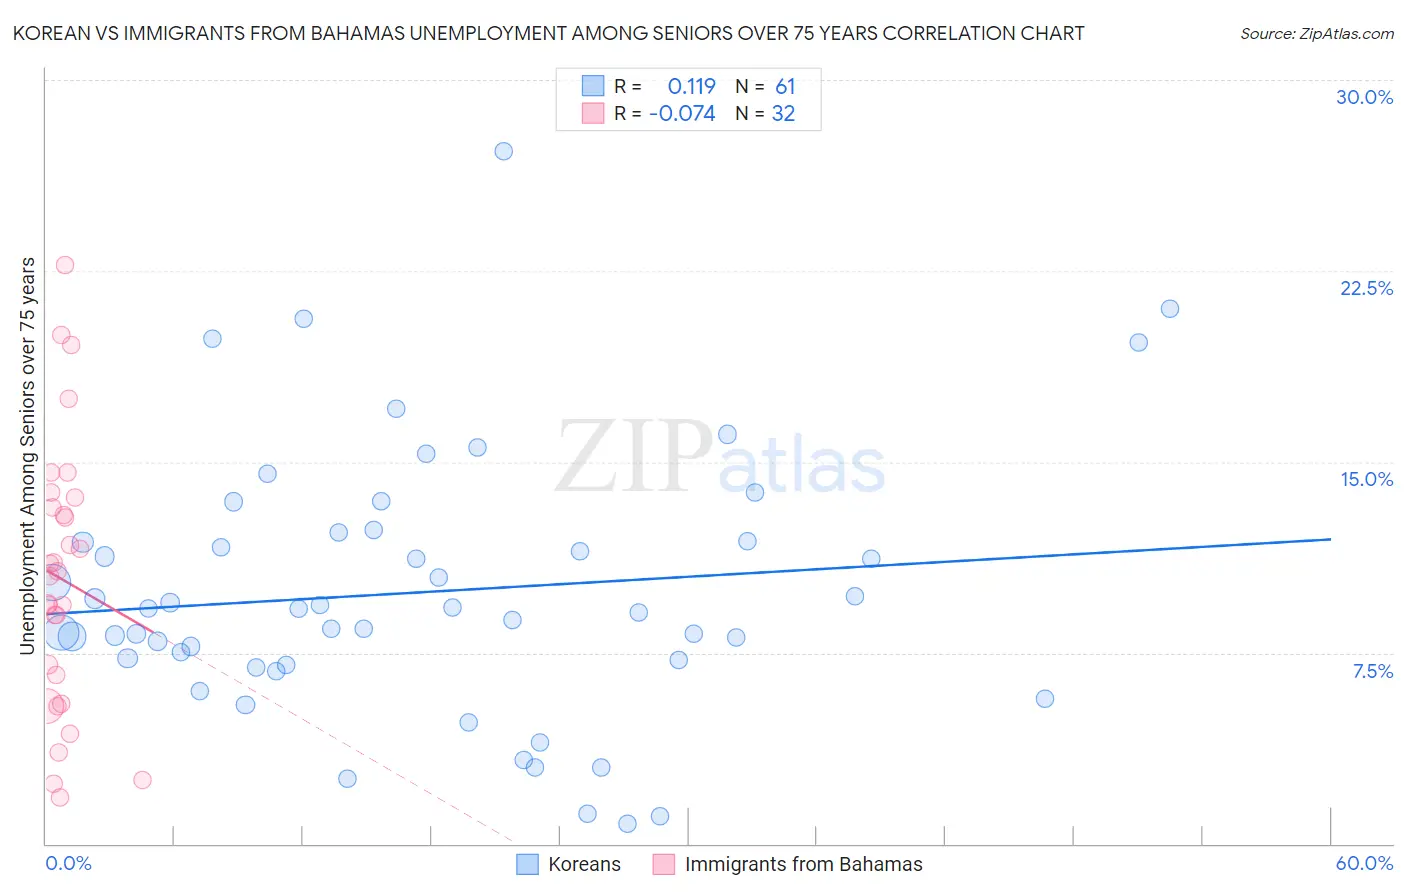
Korean vs Immigrants from Bahamas Unemployment Among Seniors over 75 years Correlation Chart
The statistical analysis conducted on geographies consisting of 228,730,103 people shows a poor positive correlation between the proportion of Koreans and unemployment rate among seniors over the age of 75 in the United States with a correlation coefficient (R) of 0.119 and weighted average of 8.9%. Similarly, the statistical analysis conducted on geographies consisting of 77,798,406 people shows a slight negative correlation between the proportion of Immigrants from Bahamas and unemployment rate among seniors over the age of 75 in the United States with a correlation coefficient (R) of -0.074 and weighted average of 8.6%, a difference of 3.3%.
Unemployment Among Seniors over 75 years Correlation Summary
| Measurement | Korean | Immigrants from Bahamas |
| Minimum | 0.80% | 1.8% |
| Maximum | 27.2% | 22.7% |
| Range | 26.4% | 20.9% |
| Mean | 9.9% | 10.4% |
| Median | 9.2% | 10.6% |
| Interquartile 25% (IQ1) | 7.1% | 6.1% |
| Interquartile 75% (IQ3) | 12.1% | 13.4% |
| Interquartile Range (IQR) | 5.0% | 7.3% |
| Standard Deviation (Sample) | 5.2% | 5.2% |
| Standard Deviation (Population) | 5.1% | 5.2% |
Similar Demographics by Unemployment Among Seniors over 75 years
Demographics Similar to Koreans by Unemployment Among Seniors over 75 years
In terms of unemployment among seniors over 75 years, the demographic groups most similar to Koreans are Spaniard (8.9%, a difference of 0.010%), Immigrants from Northern Europe (8.9%, a difference of 0.15%), Russian (8.9%, a difference of 0.17%), Immigrants from Peru (8.9%, a difference of 0.18%), and Pakistani (8.9%, a difference of 0.26%).
| Demographics | Rating | Rank | Unemployment Among Seniors over 75 years |
| Eastern Europeans | 25.9 /100 | #198 | Fair 8.9% |
| Pakistanis | 25.4 /100 | #199 | Fair 8.9% |
| Osage | 25.4 /100 | #200 | Fair 8.9% |
| Immigrants | Peru | 24.3 /100 | #201 | Fair 8.9% |
| Russians | 24.1 /100 | #202 | Fair 8.9% |
| Immigrants | Northern Europe | 23.9 /100 | #203 | Fair 8.9% |
| Spaniards | 22.0 /100 | #204 | Fair 8.9% |
| Koreans | 21.9 /100 | #205 | Fair 8.9% |
| Immigrants | Western Europe | 18.2 /100 | #206 | Poor 8.9% |
| Malaysians | 16.3 /100 | #207 | Poor 8.9% |
| Immigrants | Philippines | 15.8 /100 | #208 | Poor 8.9% |
| Salvadorans | 15.4 /100 | #209 | Poor 8.9% |
| Bermudans | 15.0 /100 | #210 | Poor 8.9% |
| Delaware | 14.6 /100 | #211 | Poor 9.0% |
| Romanians | 13.8 /100 | #212 | Poor 9.0% |
Demographics Similar to Immigrants from Bahamas by Unemployment Among Seniors over 75 years
In terms of unemployment among seniors over 75 years, the demographic groups most similar to Immigrants from Bahamas are Turkish (8.6%, a difference of 0.010%), Ethiopian (8.6%, a difference of 0.090%), Shoshone (8.6%, a difference of 0.14%), Ecuadorian (8.6%, a difference of 0.16%), and Immigrants from Pakistan (8.6%, a difference of 0.26%).
| Demographics | Rating | Rank | Unemployment Among Seniors over 75 years |
| Immigrants | Ecuador | 84.6 /100 | #149 | Excellent 8.5% |
| Paiute | 82.5 /100 | #150 | Excellent 8.6% |
| Immigrants | Bosnia and Herzegovina | 80.6 /100 | #151 | Excellent 8.6% |
| Latvians | 80.5 /100 | #152 | Excellent 8.6% |
| Mongolians | 80.1 /100 | #153 | Excellent 8.6% |
| Immigrants | Pakistan | 79.7 /100 | #154 | Good 8.6% |
| Ecuadorians | 78.5 /100 | #155 | Good 8.6% |
| Immigrants | Bahamas | 76.5 /100 | #156 | Good 8.6% |
| Turks | 76.4 /100 | #157 | Good 8.6% |
| Ethiopians | 75.3 /100 | #158 | Good 8.6% |
| Shoshone | 74.6 /100 | #159 | Good 8.6% |
| Cree | 72.8 /100 | #160 | Good 8.6% |
| Albanians | 72.8 /100 | #161 | Good 8.6% |
| Immigrants | South America | 71.3 /100 | #162 | Good 8.6% |
| Immigrants | Guatemala | 68.4 /100 | #163 | Good 8.7% |