Kiowa vs Immigrants from Lebanon Unemployment Among Ages 30 to 34 years
COMPARE
Kiowa
Immigrants from Lebanon
Unemployment Among Ages 30 to 34 years
Unemployment Among Ages 30 to 34 years Comparison
Kiowa
Immigrants from Lebanon
6.7%
UNEMPLOYMENT AMONG AGES 30 TO 34 YEARS
0.0/ 100
METRIC RATING
304th/ 347
METRIC RANK
5.5%
UNEMPLOYMENT AMONG AGES 30 TO 34 YEARS
43.5/ 100
METRIC RATING
181st/ 347
METRIC RANK
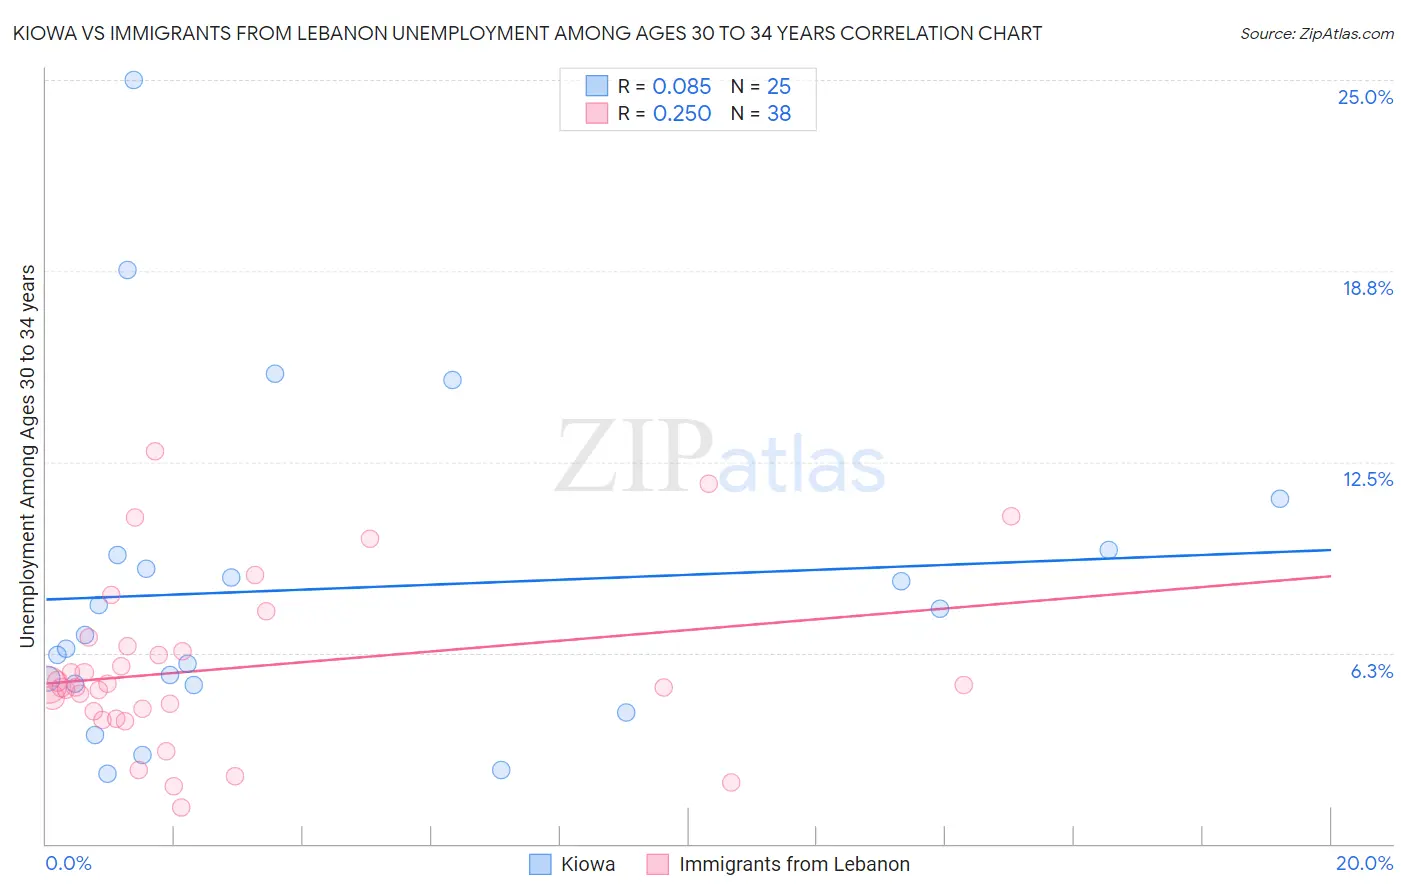
Kiowa vs Immigrants from Lebanon Unemployment Among Ages 30 to 34 years Correlation Chart
The statistical analysis conducted on geographies consisting of 55,274,953 people shows a slight positive correlation between the proportion of Kiowa and unemployment rate among population between the ages 30 and 34 in the United States with a correlation coefficient (R) of 0.085 and weighted average of 6.7%. Similarly, the statistical analysis conducted on geographies consisting of 210,846,341 people shows a weak positive correlation between the proportion of Immigrants from Lebanon and unemployment rate among population between the ages 30 and 34 in the United States with a correlation coefficient (R) of 0.250 and weighted average of 5.5%, a difference of 22.1%.
Unemployment Among Ages 30 to 34 years Correlation Summary
| Measurement | Kiowa | Immigrants from Lebanon |
| Minimum | 2.3% | 1.2% |
| Maximum | 25.0% | 12.8% |
| Range | 22.7% | 11.6% |
| Mean | 8.3% | 5.7% |
| Median | 6.8% | 5.2% |
| Interquartile 25% (IQ1) | 5.2% | 4.4% |
| Interquartile 75% (IQ3) | 9.5% | 6.4% |
| Interquartile Range (IQR) | 4.3% | 2.1% |
| Standard Deviation (Sample) | 5.4% | 2.7% |
| Standard Deviation (Population) | 5.3% | 2.7% |
Similar Demographics by Unemployment Among Ages 30 to 34 years
Demographics Similar to Kiowa by Unemployment Among Ages 30 to 34 years
In terms of unemployment among ages 30 to 34 years, the demographic groups most similar to Kiowa are Paiute (6.7%, a difference of 0.040%), Cajun (6.7%, a difference of 0.42%), Delaware (6.7%, a difference of 0.61%), Belizean (6.6%, a difference of 1.5%), and Bahamian (6.6%, a difference of 1.8%).
| Demographics | Rating | Rank | Unemployment Among Ages 30 to 34 years |
| Creek | 0.0 /100 | #297 | Tragic 6.6% |
| Immigrants | Barbados | 0.0 /100 | #298 | Tragic 6.6% |
| Dutch West Indians | 0.0 /100 | #299 | Tragic 6.6% |
| Bahamians | 0.0 /100 | #300 | Tragic 6.6% |
| Belizeans | 0.0 /100 | #301 | Tragic 6.6% |
| Delaware | 0.0 /100 | #302 | Tragic 6.7% |
| Cajuns | 0.0 /100 | #303 | Tragic 6.7% |
| Kiowa | 0.0 /100 | #304 | Tragic 6.7% |
| Paiute | 0.0 /100 | #305 | Tragic 6.7% |
| Immigrants | Armenia | 0.0 /100 | #306 | Tragic 6.8% |
| Immigrants | Belize | 0.0 /100 | #307 | Tragic 6.9% |
| Immigrants | Azores | 0.0 /100 | #308 | Tragic 6.9% |
| Immigrants | Grenada | 0.0 /100 | #309 | Tragic 6.9% |
| Immigrants | St. Vincent and the Grenadines | 0.0 /100 | #310 | Tragic 7.0% |
| Alaskan Athabascans | 0.0 /100 | #311 | Tragic 7.0% |
Demographics Similar to Immigrants from Lebanon by Unemployment Among Ages 30 to 34 years
In terms of unemployment among ages 30 to 34 years, the demographic groups most similar to Immigrants from Lebanon are Immigrants from Denmark (5.5%, a difference of 0.010%), Hungarian (5.5%, a difference of 0.030%), Malaysian (5.5%, a difference of 0.12%), Italian (5.5%, a difference of 0.14%), and Costa Rican (5.5%, a difference of 0.23%).
| Demographics | Rating | Rank | Unemployment Among Ages 30 to 34 years |
| Immigrants | Laos | 50.0 /100 | #174 | Average 5.5% |
| Afghans | 49.6 /100 | #175 | Average 5.5% |
| Immigrants | Peru | 48.0 /100 | #176 | Average 5.5% |
| Immigrants | Ukraine | 47.7 /100 | #177 | Average 5.5% |
| Macedonians | 47.1 /100 | #178 | Average 5.5% |
| Costa Ricans | 46.7 /100 | #179 | Average 5.5% |
| Italians | 45.5 /100 | #180 | Average 5.5% |
| Immigrants | Lebanon | 43.5 /100 | #181 | Average 5.5% |
| Immigrants | Denmark | 43.4 /100 | #182 | Average 5.5% |
| Hungarians | 43.1 /100 | #183 | Average 5.5% |
| Malaysians | 41.8 /100 | #184 | Average 5.5% |
| Immigrants | Western Europe | 39.1 /100 | #185 | Fair 5.5% |
| Canadians | 38.2 /100 | #186 | Fair 5.5% |
| Immigrants | Western Asia | 38.2 /100 | #187 | Fair 5.5% |
| Immigrants | Norway | 36.1 /100 | #188 | Fair 5.5% |