Kiowa vs Immigrants from Latvia Unemployment Among Seniors over 65 years
COMPARE
Kiowa
Immigrants from Latvia
Unemployment Among Seniors over 65 years
Unemployment Among Seniors over 65 years Comparison
Kiowa
Immigrants from Latvia
4.8%
UNEMPLOYMENT AMONG SENIORS OVER 65 YEARS
99.9/ 100
METRIC RATING
41st/ 347
METRIC RANK
5.0%
UNEMPLOYMENT AMONG SENIORS OVER 65 YEARS
91.4/ 100
METRIC RATING
114th/ 347
METRIC RANK
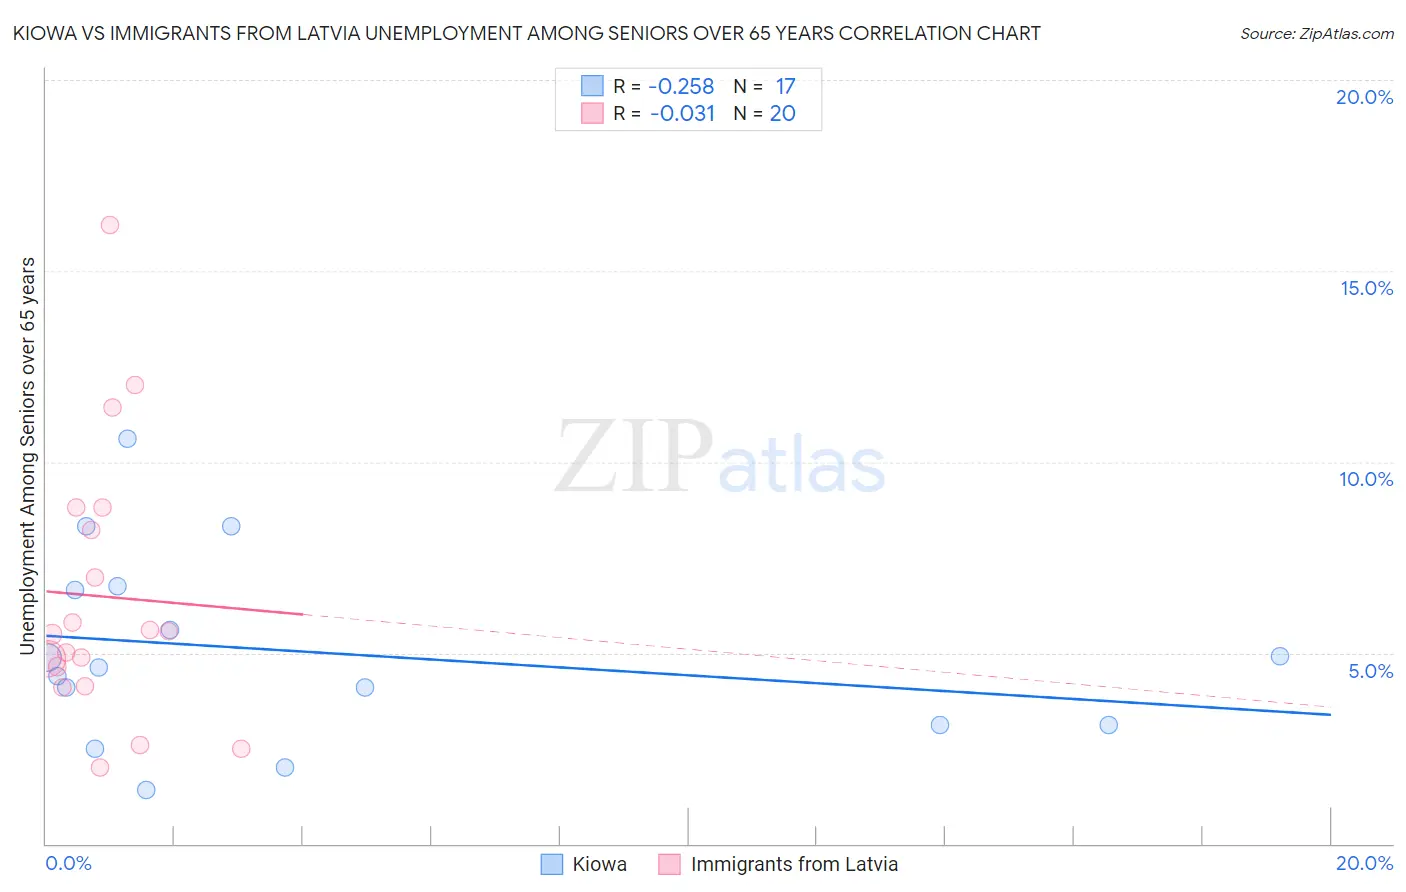
Kiowa vs Immigrants from Latvia Unemployment Among Seniors over 65 years Correlation Chart
The statistical analysis conducted on geographies consisting of 54,066,098 people shows a weak negative correlation between the proportion of Kiowa and unemployment rate amomg seniors over the age of 65 in the United States with a correlation coefficient (R) of -0.258 and weighted average of 4.8%. Similarly, the statistical analysis conducted on geographies consisting of 109,708,285 people shows no correlation between the proportion of Immigrants from Latvia and unemployment rate amomg seniors over the age of 65 in the United States with a correlation coefficient (R) of -0.031 and weighted average of 5.0%, a difference of 4.2%.
Unemployment Among Seniors over 65 years Correlation Summary
| Measurement | Kiowa | Immigrants from Latvia |
| Minimum | 1.4% | 2.0% |
| Maximum | 10.6% | 16.2% |
| Range | 9.2% | 14.2% |
| Mean | 5.0% | 6.5% |
| Median | 4.6% | 5.5% |
| Interquartile 25% (IQ1) | 3.1% | 4.4% |
| Interquartile 75% (IQ3) | 6.7% | 8.5% |
| Interquartile Range (IQR) | 3.6% | 4.1% |
| Standard Deviation (Sample) | 2.5% | 3.5% |
| Standard Deviation (Population) | 2.4% | 3.5% |
Similar Demographics by Unemployment Among Seniors over 65 years
Demographics Similar to Kiowa by Unemployment Among Seniors over 65 years
In terms of unemployment among seniors over 65 years, the demographic groups most similar to Kiowa are Swiss (4.8%, a difference of 0.0%), Luxembourger (4.8%, a difference of 0.010%), Immigrants from Sweden (4.8%, a difference of 0.050%), Jordanian (4.9%, a difference of 0.11%), and Ethiopian (4.9%, a difference of 0.15%).
| Demographics | Rating | Rank | Unemployment Among Seniors over 65 years |
| Bhutanese | 100.0 /100 | #34 | Exceptional 4.8% |
| Immigrants | Kuwait | 100.0 /100 | #35 | Exceptional 4.8% |
| Cambodians | 100.0 /100 | #36 | Exceptional 4.8% |
| Bulgarians | 99.9 /100 | #37 | Exceptional 4.8% |
| Immigrants | India | 99.9 /100 | #38 | Exceptional 4.8% |
| Macedonians | 99.9 /100 | #39 | Exceptional 4.8% |
| Immigrants | Sweden | 99.9 /100 | #40 | Exceptional 4.8% |
| Kiowa | 99.9 /100 | #41 | Exceptional 4.8% |
| Swiss | 99.9 /100 | #42 | Exceptional 4.8% |
| Luxembourgers | 99.9 /100 | #43 | Exceptional 4.8% |
| Jordanians | 99.9 /100 | #44 | Exceptional 4.9% |
| Ethiopians | 99.9 /100 | #45 | Exceptional 4.9% |
| Immigrants | Jordan | 99.9 /100 | #46 | Exceptional 4.9% |
| Germans | 99.9 /100 | #47 | Exceptional 4.9% |
| Choctaw | 99.9 /100 | #48 | Exceptional 4.9% |
Demographics Similar to Immigrants from Latvia by Unemployment Among Seniors over 65 years
In terms of unemployment among seniors over 65 years, the demographic groups most similar to Immigrants from Latvia are Seminole (5.0%, a difference of 0.0%), Celtic (5.0%, a difference of 0.010%), Immigrants from Korea (5.0%, a difference of 0.040%), Eastern European (5.0%, a difference of 0.060%), and Finnish (5.0%, a difference of 0.090%).
| Demographics | Rating | Rank | Unemployment Among Seniors over 65 years |
| Immigrants | Germany | 93.2 /100 | #107 | Exceptional 5.0% |
| Immigrants | Vietnam | 92.9 /100 | #108 | Exceptional 5.0% |
| Immigrants | Malaysia | 92.7 /100 | #109 | Exceptional 5.0% |
| Immigrants | Saudi Arabia | 92.7 /100 | #110 | Exceptional 5.0% |
| Finns | 92.2 /100 | #111 | Exceptional 5.0% |
| Eastern Europeans | 92.0 /100 | #112 | Exceptional 5.0% |
| Seminole | 91.4 /100 | #113 | Exceptional 5.0% |
| Immigrants | Latvia | 91.4 /100 | #114 | Exceptional 5.0% |
| Celtics | 91.3 /100 | #115 | Exceptional 5.0% |
| Immigrants | Korea | 91.0 /100 | #116 | Exceptional 5.0% |
| Malaysians | 90.4 /100 | #117 | Exceptional 5.1% |
| Soviet Union | 90.1 /100 | #118 | Exceptional 5.1% |
| Immigrants | Canada | 89.7 /100 | #119 | Excellent 5.1% |
| Irish | 88.8 /100 | #120 | Excellent 5.1% |
| Puget Sound Salish | 88.7 /100 | #121 | Excellent 5.1% |