Kiowa vs Immigrants from Europe Unemployment Among Women with Children Under 6 years
COMPARE
Kiowa
Immigrants from Europe
Unemployment Among Women with Children Under 6 years
Unemployment Among Women with Children Under 6 years Comparison
Kiowa
Immigrants from Europe
8.0%
UNEMPLOYMENT AMONG WOMEN WITH CHILDREN UNDER 6 YEARS
4.4/ 100
METRIC RATING
234th/ 347
METRIC RANK
7.2%
UNEMPLOYMENT AMONG WOMEN WITH CHILDREN UNDER 6 YEARS
97.5/ 100
METRIC RATING
99th/ 347
METRIC RANK
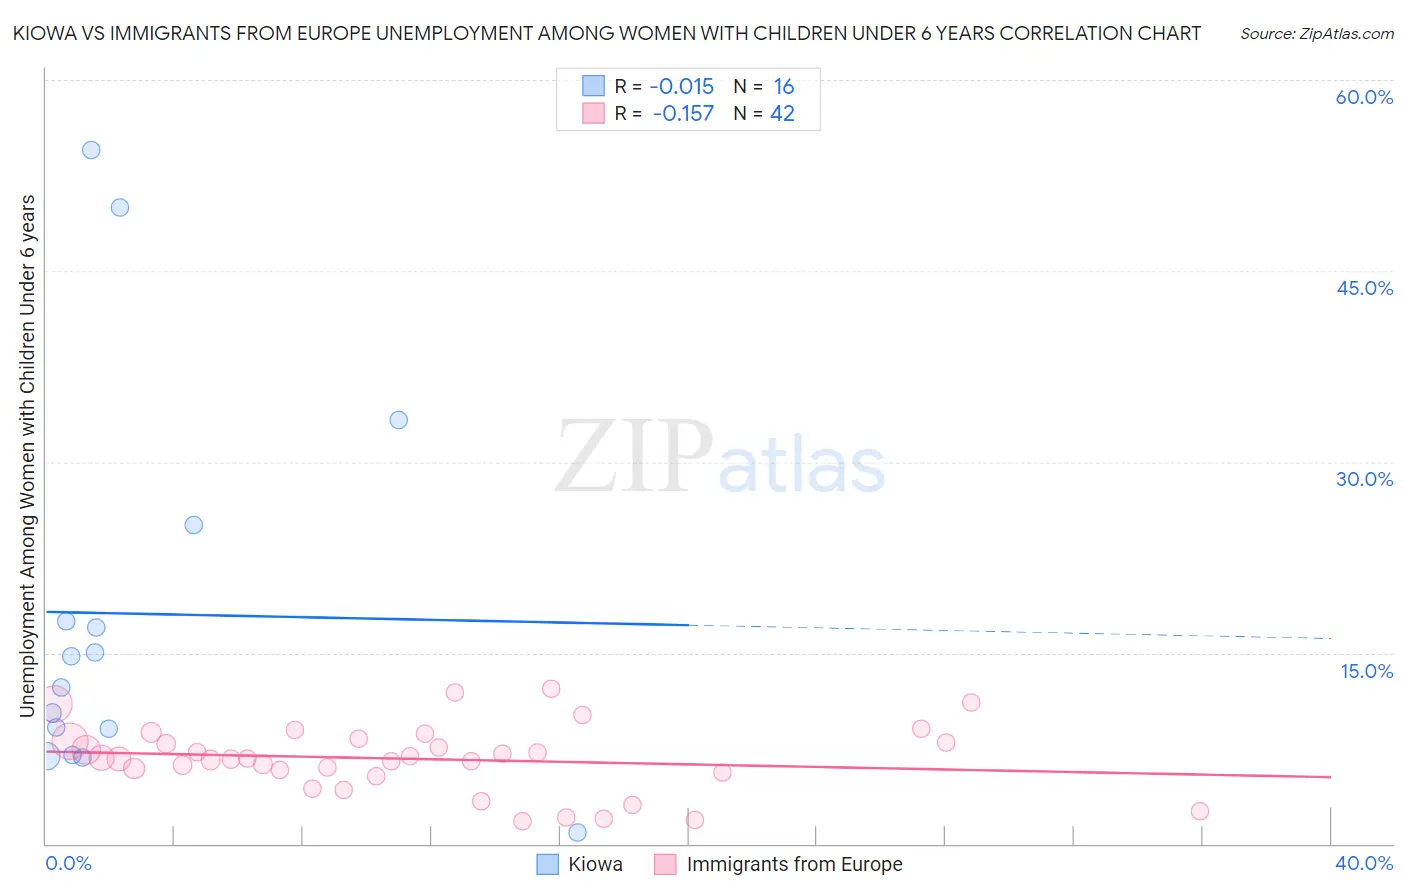
Kiowa vs Immigrants from Europe Unemployment Among Women with Children Under 6 years Correlation Chart
The statistical analysis conducted on geographies consisting of 51,955,619 people shows no correlation between the proportion of Kiowa and unemployment rate among women with children under the age of 6 in the United States with a correlation coefficient (R) of -0.015 and weighted average of 8.0%. Similarly, the statistical analysis conducted on geographies consisting of 372,239,428 people shows a poor negative correlation between the proportion of Immigrants from Europe and unemployment rate among women with children under the age of 6 in the United States with a correlation coefficient (R) of -0.157 and weighted average of 7.2%, a difference of 11.9%.
Unemployment Among Women with Children Under 6 years Correlation Summary
| Measurement | Kiowa | Immigrants from Europe |
| Minimum | 0.90% | 1.8% |
| Maximum | 54.5% | 12.2% |
| Range | 53.6% | 10.4% |
| Mean | 18.1% | 6.7% |
| Median | 13.5% | 6.7% |
| Interquartile 25% (IQ1) | 8.0% | 5.6% |
| Interquartile 75% (IQ3) | 21.2% | 8.1% |
| Interquartile Range (IQR) | 13.2% | 2.5% |
| Standard Deviation (Sample) | 15.4% | 2.6% |
| Standard Deviation (Population) | 15.0% | 2.6% |
Similar Demographics by Unemployment Among Women with Children Under 6 years
Demographics Similar to Kiowa by Unemployment Among Women with Children Under 6 years
In terms of unemployment among women with children under 6 years, the demographic groups most similar to Kiowa are Comanche (8.0%, a difference of 0.040%), Immigrants from Barbados (8.0%, a difference of 0.050%), Immigrants from Costa Rica (8.0%, a difference of 0.12%), Immigrants from Trinidad and Tobago (8.0%, a difference of 0.15%), and Welsh (8.0%, a difference of 0.23%).
| Demographics | Rating | Rank | Unemployment Among Women with Children Under 6 years |
| Portuguese | 6.2 /100 | #227 | Tragic 8.0% |
| Immigrants | Sudan | 6.0 /100 | #228 | Tragic 8.0% |
| Salvadorans | 5.5 /100 | #229 | Tragic 8.0% |
| Finns | 5.3 /100 | #230 | Tragic 8.0% |
| Trinidadians and Tobagonians | 5.3 /100 | #231 | Tragic 8.0% |
| Welsh | 5.0 /100 | #232 | Tragic 8.0% |
| Immigrants | Trinidad and Tobago | 4.8 /100 | #233 | Tragic 8.0% |
| Kiowa | 4.4 /100 | #234 | Tragic 8.0% |
| Comanche | 4.3 /100 | #235 | Tragic 8.0% |
| Immigrants | Barbados | 4.2 /100 | #236 | Tragic 8.0% |
| Immigrants | Costa Rica | 4.1 /100 | #237 | Tragic 8.0% |
| Immigrants | Middle Africa | 3.2 /100 | #238 | Tragic 8.1% |
| Irish | 2.7 /100 | #239 | Tragic 8.1% |
| Immigrants | El Salvador | 2.6 /100 | #240 | Tragic 8.1% |
| Liberians | 2.6 /100 | #241 | Tragic 8.1% |
Demographics Similar to Immigrants from Europe by Unemployment Among Women with Children Under 6 years
In terms of unemployment among women with children under 6 years, the demographic groups most similar to Immigrants from Europe are Russian (7.2%, a difference of 0.040%), Immigrants from Northern Europe (7.2%, a difference of 0.040%), Immigrants from South Eastern Asia (7.2%, a difference of 0.070%), Chilean (7.2%, a difference of 0.070%), and Immigrants from Nicaragua (7.2%, a difference of 0.10%).
| Demographics | Rating | Rank | Unemployment Among Women with Children Under 6 years |
| Albanians | 98.0 /100 | #92 | Exceptional 7.2% |
| New Zealanders | 97.8 /100 | #93 | Exceptional 7.2% |
| Macedonians | 97.7 /100 | #94 | Exceptional 7.2% |
| Romanians | 97.7 /100 | #95 | Exceptional 7.2% |
| Immigrants | Eastern Africa | 97.7 /100 | #96 | Exceptional 7.2% |
| Immigrants | South Eastern Asia | 97.6 /100 | #97 | Exceptional 7.2% |
| Russians | 97.5 /100 | #98 | Exceptional 7.2% |
| Immigrants | Europe | 97.5 /100 | #99 | Exceptional 7.2% |
| Immigrants | Northern Europe | 97.4 /100 | #100 | Exceptional 7.2% |
| Chileans | 97.4 /100 | #101 | Exceptional 7.2% |
| Immigrants | Nicaragua | 97.3 /100 | #102 | Exceptional 7.2% |
| Immigrants | Saudi Arabia | 97.3 /100 | #103 | Exceptional 7.2% |
| Immigrants | Egypt | 97.2 /100 | #104 | Exceptional 7.2% |
| Venezuelans | 97.2 /100 | #105 | Exceptional 7.2% |
| Immigrants | Pakistan | 97.2 /100 | #106 | Exceptional 7.2% |