Kenyan vs Potawatomi Unemployment Among Ages 25 to 29 years
COMPARE
Kenyan
Potawatomi
Unemployment Among Ages 25 to 29 years
Unemployment Among Ages 25 to 29 years Comparison
Kenyans
Potawatomi
6.3%
UNEMPLOYMENT AMONG AGES 25 TO 29 YEARS
98.0/ 100
METRIC RATING
63rd/ 347
METRIC RANK
7.1%
UNEMPLOYMENT AMONG AGES 25 TO 29 YEARS
1.3/ 100
METRIC RATING
239th/ 347
METRIC RANK
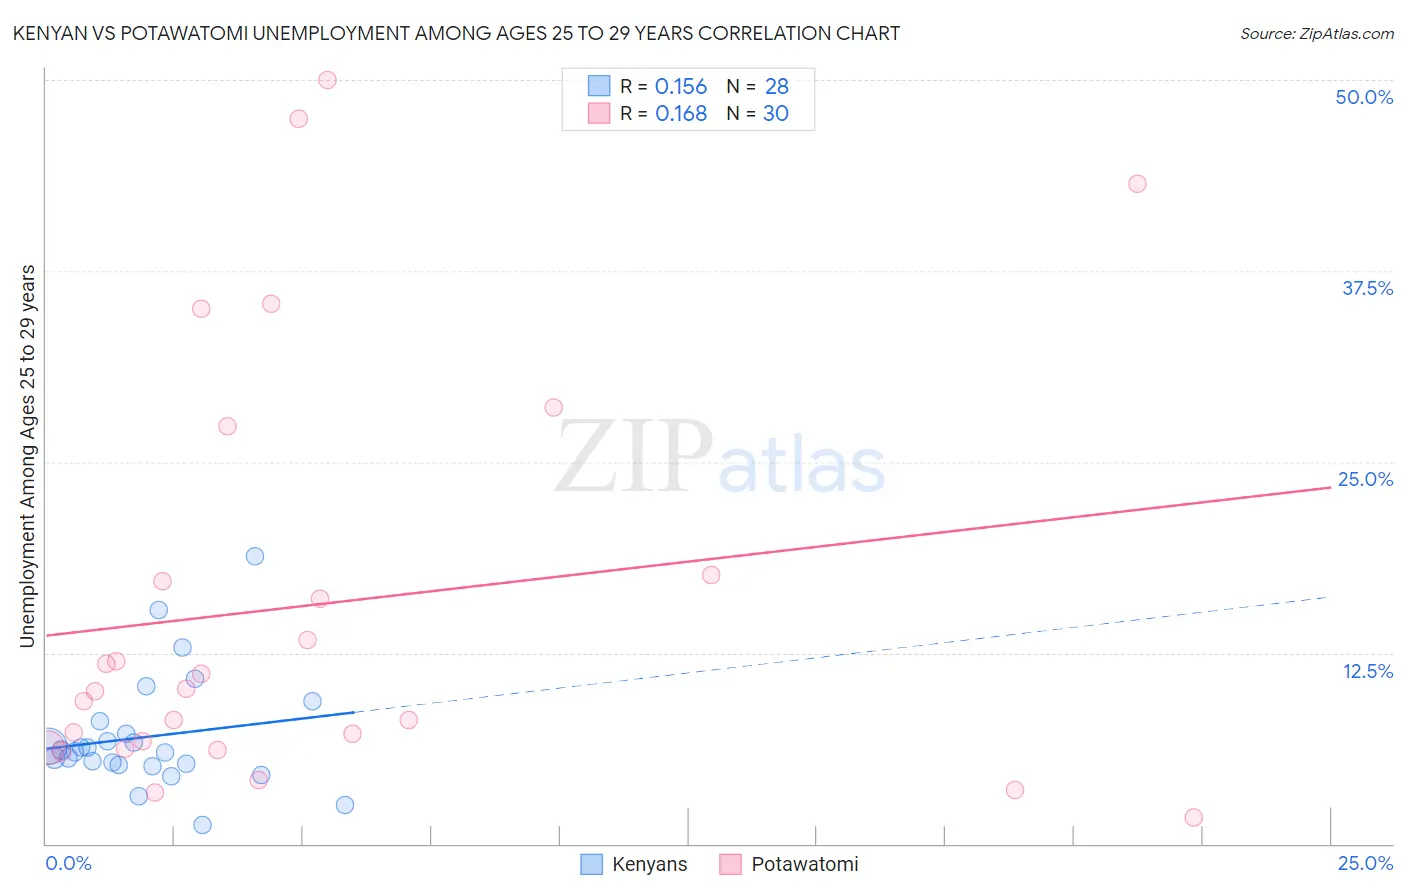
Kenyan vs Potawatomi Unemployment Among Ages 25 to 29 years Correlation Chart
The statistical analysis conducted on geographies consisting of 165,555,949 people shows a poor positive correlation between the proportion of Kenyans and unemployment rate among population between the ages 25 and 29 in the United States with a correlation coefficient (R) of 0.156 and weighted average of 6.3%. Similarly, the statistical analysis conducted on geographies consisting of 114,824,106 people shows a poor positive correlation between the proportion of Potawatomi and unemployment rate among population between the ages 25 and 29 in the United States with a correlation coefficient (R) of 0.168 and weighted average of 7.1%, a difference of 13.4%.
Unemployment Among Ages 25 to 29 years Correlation Summary
| Measurement | Kenyan | Potawatomi |
| Minimum | 1.2% | 1.7% |
| Maximum | 18.8% | 50.0% |
| Range | 17.6% | 48.3% |
| Mean | 7.0% | 15.7% |
| Median | 6.1% | 10.1% |
| Interquartile 25% (IQ1) | 5.2% | 6.3% |
| Interquartile 75% (IQ3) | 7.6% | 17.6% |
| Interquartile Range (IQR) | 2.4% | 11.3% |
| Standard Deviation (Sample) | 3.8% | 13.8% |
| Standard Deviation (Population) | 3.7% | 13.5% |
Similar Demographics by Unemployment Among Ages 25 to 29 years
Demographics Similar to Kenyans by Unemployment Among Ages 25 to 29 years
In terms of unemployment among ages 25 to 29 years, the demographic groups most similar to Kenyans are Immigrants from Sri Lanka (6.3%, a difference of 0.050%), Immigrants from China (6.2%, a difference of 0.070%), Immigrants from Lebanon (6.3%, a difference of 0.10%), Indian (Asian) (6.3%, a difference of 0.12%), and Immigrants from Northern Africa (6.3%, a difference of 0.13%).
| Demographics | Rating | Rank | Unemployment Among Ages 25 to 29 years |
| Immigrants | Burma/Myanmar | 98.7 /100 | #56 | Exceptional 6.2% |
| Immigrants | Saudi Arabia | 98.6 /100 | #57 | Exceptional 6.2% |
| Immigrants | Eastern Asia | 98.4 /100 | #58 | Exceptional 6.2% |
| Luxembourgers | 98.3 /100 | #59 | Exceptional 6.2% |
| Immigrants | Taiwan | 98.3 /100 | #60 | Exceptional 6.2% |
| Bhutanese | 98.2 /100 | #61 | Exceptional 6.2% |
| Immigrants | China | 98.1 /100 | #62 | Exceptional 6.2% |
| Kenyans | 98.0 /100 | #63 | Exceptional 6.3% |
| Immigrants | Sri Lanka | 97.9 /100 | #64 | Exceptional 6.3% |
| Immigrants | Lebanon | 97.8 /100 | #65 | Exceptional 6.3% |
| Indians (Asian) | 97.8 /100 | #66 | Exceptional 6.3% |
| Immigrants | Northern Africa | 97.8 /100 | #67 | Exceptional 6.3% |
| Palestinians | 97.7 /100 | #68 | Exceptional 6.3% |
| Immigrants | Hong Kong | 97.5 /100 | #69 | Exceptional 6.3% |
| Immigrants | Malaysia | 97.5 /100 | #70 | Exceptional 6.3% |
Demographics Similar to Potawatomi by Unemployment Among Ages 25 to 29 years
In terms of unemployment among ages 25 to 29 years, the demographic groups most similar to Potawatomi are Native Hawaiian (7.1%, a difference of 0.030%), Immigrants from Sierra Leone (7.1%, a difference of 0.070%), Spanish American Indian (7.1%, a difference of 0.34%), Honduran (7.1%, a difference of 0.46%), and Yaqui (7.1%, a difference of 0.46%).
| Demographics | Rating | Rank | Unemployment Among Ages 25 to 29 years |
| Spanish Americans | 2.7 /100 | #232 | Tragic 7.0% |
| Immigrants | Honduras | 2.4 /100 | #233 | Tragic 7.0% |
| French Canadians | 2.4 /100 | #234 | Tragic 7.0% |
| Panamanians | 2.1 /100 | #235 | Tragic 7.0% |
| Cape Verdeans | 1.9 /100 | #236 | Tragic 7.0% |
| Puget Sound Salish | 1.8 /100 | #237 | Tragic 7.1% |
| Hondurans | 1.8 /100 | #238 | Tragic 7.1% |
| Potawatomi | 1.3 /100 | #239 | Tragic 7.1% |
| Native Hawaiians | 1.3 /100 | #240 | Tragic 7.1% |
| Immigrants | Sierra Leone | 1.3 /100 | #241 | Tragic 7.1% |
| Spanish American Indians | 1.1 /100 | #242 | Tragic 7.1% |
| Yaqui | 1.0 /100 | #243 | Tragic 7.1% |
| Immigrants | Nonimmigrants | 0.9 /100 | #244 | Tragic 7.1% |
| Guatemalans | 0.9 /100 | #245 | Tragic 7.1% |
| Immigrants | Uzbekistan | 0.7 /100 | #246 | Tragic 7.2% |