Kenyan vs Delaware Unemployment Among Ages 20 to 24 years
COMPARE
Kenyan
Delaware
Unemployment Among Ages 20 to 24 years
Unemployment Among Ages 20 to 24 years Comparison
Kenyans
Delaware
9.9%
UNEMPLOYMENT AMONG AGES 20 TO 24 YEARS
98.7/ 100
METRIC RATING
73rd/ 347
METRIC RANK
11.3%
UNEMPLOYMENT AMONG AGES 20 TO 24 YEARS
0.0/ 100
METRIC RATING
270th/ 347
METRIC RANK
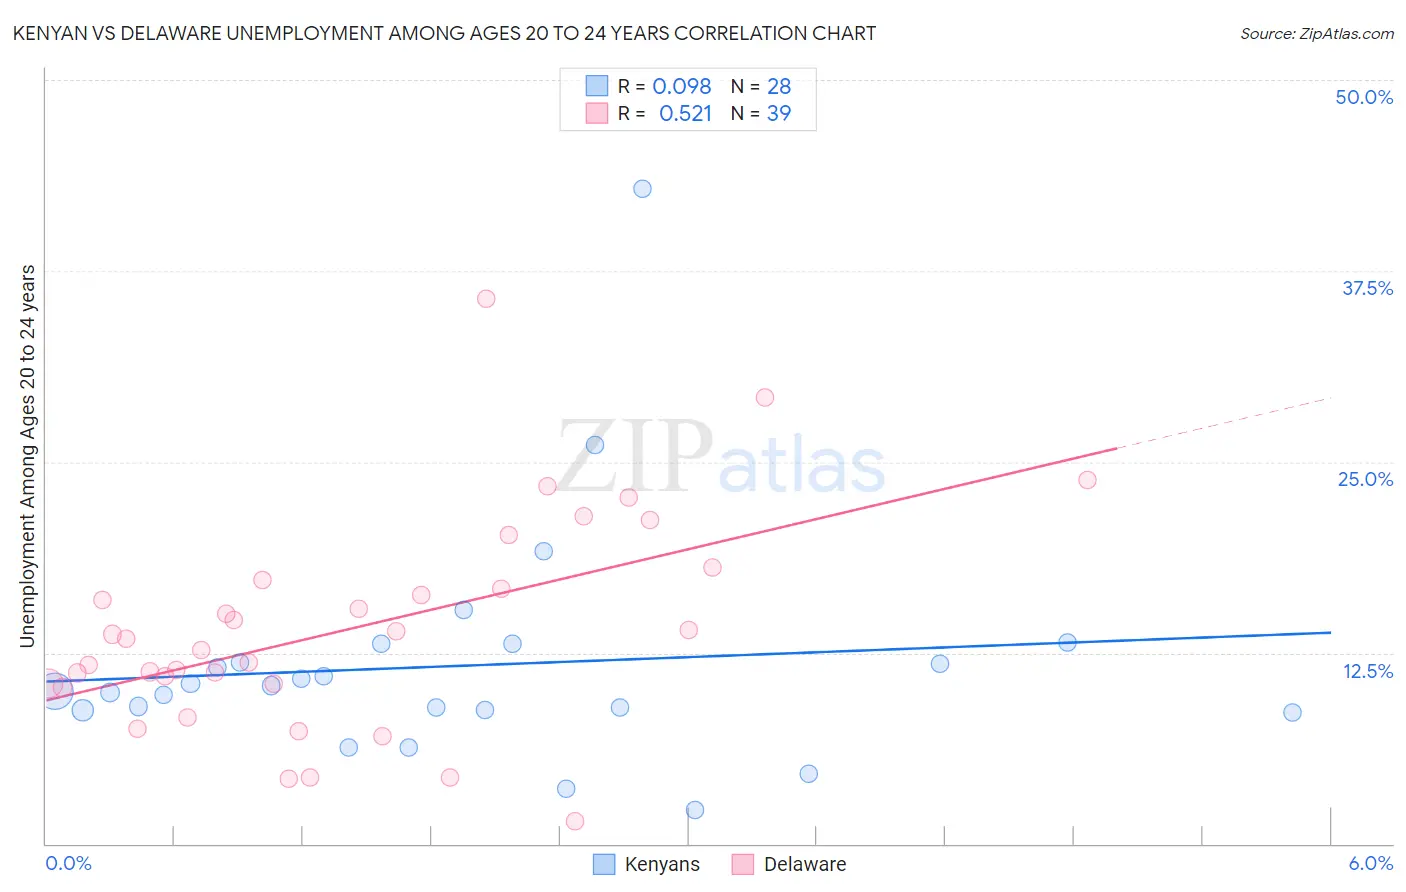
Kenyan vs Delaware Unemployment Among Ages 20 to 24 years Correlation Chart
The statistical analysis conducted on geographies consisting of 166,817,743 people shows a slight positive correlation between the proportion of Kenyans and unemployment rate among population between the ages 20 and 24 in the United States with a correlation coefficient (R) of 0.098 and weighted average of 9.9%. Similarly, the statistical analysis conducted on geographies consisting of 94,864,016 people shows a substantial positive correlation between the proportion of Delaware and unemployment rate among population between the ages 20 and 24 in the United States with a correlation coefficient (R) of 0.521 and weighted average of 11.3%, a difference of 14.0%.
Unemployment Among Ages 20 to 24 years Correlation Summary
| Measurement | Kenyan | Delaware |
| Minimum | 2.2% | 1.5% |
| Maximum | 42.9% | 35.7% |
| Range | 40.7% | 34.2% |
| Mean | 11.6% | 14.1% |
| Median | 10.2% | 13.4% |
| Interquartile 25% (IQ1) | 8.7% | 10.4% |
| Interquartile 75% (IQ3) | 12.5% | 17.3% |
| Interquartile Range (IQR) | 3.7% | 6.8% |
| Standard Deviation (Sample) | 7.7% | 7.0% |
| Standard Deviation (Population) | 7.5% | 6.9% |
Similar Demographics by Unemployment Among Ages 20 to 24 years
Demographics Similar to Kenyans by Unemployment Among Ages 20 to 24 years
In terms of unemployment among ages 20 to 24 years, the demographic groups most similar to Kenyans are Immigrants from Laos (9.9%, a difference of 0.030%), Immigrants from Australia (9.9%, a difference of 0.10%), Bolivian (9.9%, a difference of 0.14%), Celtic (9.9%, a difference of 0.18%), and Czechoslovakian (9.9%, a difference of 0.19%).
| Demographics | Rating | Rank | Unemployment Among Ages 20 to 24 years |
| Scottish | 99.3 /100 | #66 | Exceptional 9.8% |
| Immigrants | Bolivia | 99.2 /100 | #67 | Exceptional 9.9% |
| Mongolians | 99.1 /100 | #68 | Exceptional 9.9% |
| Bulgarians | 99.1 /100 | #69 | Exceptional 9.9% |
| Immigrants | Croatia | 99.0 /100 | #70 | Exceptional 9.9% |
| Celtics | 98.9 /100 | #71 | Exceptional 9.9% |
| Bolivians | 98.9 /100 | #72 | Exceptional 9.9% |
| Kenyans | 98.7 /100 | #73 | Exceptional 9.9% |
| Immigrants | Laos | 98.7 /100 | #74 | Exceptional 9.9% |
| Immigrants | Australia | 98.6 /100 | #75 | Exceptional 9.9% |
| Czechoslovakians | 98.4 /100 | #76 | Exceptional 9.9% |
| Chickasaw | 98.4 /100 | #77 | Exceptional 9.9% |
| Assyrians/Chaldeans/Syriacs | 98.3 /100 | #78 | Exceptional 9.9% |
| Icelanders | 98.3 /100 | #79 | Exceptional 9.9% |
| Immigrants | Netherlands | 98.2 /100 | #80 | Exceptional 9.9% |
Demographics Similar to Delaware by Unemployment Among Ages 20 to 24 years
In terms of unemployment among ages 20 to 24 years, the demographic groups most similar to Delaware are Ute (11.2%, a difference of 0.58%), Maltese (11.2%, a difference of 0.97%), Immigrants from Uzbekistan (11.4%, a difference of 1.1%), Nigerian (11.4%, a difference of 1.1%), and Immigrants from Greece (11.1%, a difference of 1.4%).
| Demographics | Rating | Rank | Unemployment Among Ages 20 to 24 years |
| Marshallese | 0.1 /100 | #263 | Tragic 11.0% |
| Sub-Saharan Africans | 0.0 /100 | #264 | Tragic 11.1% |
| Immigrants | Ireland | 0.0 /100 | #265 | Tragic 11.1% |
| Immigrants | Liberia | 0.0 /100 | #266 | Tragic 11.1% |
| Immigrants | Greece | 0.0 /100 | #267 | Tragic 11.1% |
| Maltese | 0.0 /100 | #268 | Tragic 11.2% |
| Ute | 0.0 /100 | #269 | Tragic 11.2% |
| Delaware | 0.0 /100 | #270 | Tragic 11.3% |
| Immigrants | Uzbekistan | 0.0 /100 | #271 | Tragic 11.4% |
| Nigerians | 0.0 /100 | #272 | Tragic 11.4% |
| Immigrants | Nigeria | 0.0 /100 | #273 | Tragic 11.5% |
| Cape Verdeans | 0.0 /100 | #274 | Tragic 11.5% |
| Senegalese | 0.0 /100 | #275 | Tragic 11.5% |
| Sierra Leoneans | 0.0 /100 | #276 | Tragic 11.5% |
| Africans | 0.0 /100 | #277 | Tragic 11.5% |