Jordanian vs Yakama Unemployment Among Ages 55 to 59 years

COMPARE

Jordanian
Race
Ancestry
AfghanAfricanAlaska NativeAlaskan AthabascanAlbanianAleutAlsatianAmericanApacheArabArapahoArgentineanArmenianAssyrian/Chaldean/SyriacAustralianAustrianBahamianBangladeshiBarbadianBasqueBelgianBelizeanBermudanBhutaneseBlackfeetBolivianBrazilianBritishBritish West IndianBulgarianBurmeseCajunCambodianCanadianCape VerdeanCarpatho RusynCelticCentral AmericanCentral American IndianCherokeeCheyenneChickasawChileanChineseChippewaChoctawColombianColvilleComancheCosta RicanCreeCreekCroatianCrowCubanCypriotCzechCzechoslovakianDanishDelawareDominicanDutchDutch West IndianEastern EuropeanEcuadorianEgyptianEnglishEstonianEthiopianEuropeanFijianFilipinoFinnishFrenchFrench American IndianFrench CanadianGermanGerman RussianGhanaianGreekGuamanian/ChamorroGuatemalanGuyaneseHaitianHmongHonduranHopiHoumaHungarianIcelanderIndian (Asian)IndonesianInupiatIranianIraqiIrishIroquoisIsraeliItalianJamaicanJapaneseJordanianKenyanKiowaKoreanLaotianLatvianLebaneseLiberianLithuanianLumbeeLuxembourgerMacedonianMalaysianMalteseMarshalleseMenomineeMexicanMexican American IndianMongolianMoroccanNative HawaiianNavajoNepaleseNew ZealanderNicaraguanNigerianNorthern EuropeanNorwegianOkinawanOsageOttawaPaiutePakistaniPalestinianPanamanianParaguayanPennsylvania GermanPeruvianPimaPolishPortuguesePotawatomiPuebloPuerto RicanPuget Sound SalishRomanianRussianSalvadoranSamoanScandinavianScotch-IrishScottishSeminoleSenegaleseSerbianShoshoneSierra LeoneanSiouxSlavicSlovakSloveneSomaliSouth AfricanSouth AmericanSouth American IndianSoviet UnionSpaniardSpanishSpanish AmericanSpanish American IndianSri LankanSubsaharan AfricanSudaneseSwedishSwissSyrianTaiwaneseThaiTlingit-HaidaTohono O'OdhamTonganTrinidadian and TobagonianTsimshianTurkishU.S. Virgin IslanderUgandanUkrainianUruguayanUteVenezuelanVietnameseWelshWest IndianYaquiYugoslavianYumanYup'ikZimbabwean
Immigration
NonimmigrantsImmigrantsAfghanistanAfricaAlbaniaArgentinaArmeniaAsiaAustraliaAustriaBahamasBangladeshBarbadosBelarusBelgiumBelizeBoliviaBosnia and HerzegovinaBrazilBulgariaBurma/MyanmarCabo VerdeCambodiaCameroonCanadaCaribbeanCentral AmericaChileChinaColombiaCongoCosta RicaCroatiaCubaCzechoslovakiaDenmarkDominicaDominican RepublicEastern AfricaEastern AsiaEastern EuropeEcuadorEgyptEl SalvadorEnglandEritreaEthiopiaEuropeFijiFranceGermanyGhanaGreeceGrenadaGuatemalaGuyanaHaitiHondurasHong KongHungaryIndiaIndonesiaIranIraqIrelandIsraelItalyJamaicaJapanJordanKazakhstanKenyaKoreaKuwaitLaosLatin AmericaLatviaLebanonLiberiaLithuaniaMalaysiaMexicoMicronesiaMiddle AfricaMoldovaMoroccoNepalNetherlandsNicaraguaNigeriaNorth AmericaNorth MacedoniaNorthern AfricaNorthern EuropeNorwayOceaniaPakistanPanamaPeruPhilippinesPolandPortugalRomaniaRussiaSaudi ArabiaScotlandSenegalSerbiaSierra LeoneSingaporeSomaliaSouth AfricaSouth AmericaSouth Central AsiaSouth Eastern AsiaSouthern EuropeSpainSri LankaSt. Vincent and the GrenadinesSudanSwedenSwitzerlandSyriaTaiwanThailandTrinidad and TobagoTurkeyUgandaUkraineUruguayUzbekistanVenezuelaVietnamWest IndiesWestern AfricaWestern AsiaWestern EuropeYemenZaireZimbabweAzores
Yakama
Race
Ancestry
AfghanAfricanAlaska NativeAlaskan AthabascanAlbanianAleutAlsatianAmericanApacheArabArapahoArgentineanArmenianAssyrian/Chaldean/SyriacAustralianAustrianBahamianBangladeshiBarbadianBasqueBelgianBelizeanBermudanBhutaneseBlackfeetBolivianBrazilianBritishBritish West IndianBulgarianBurmeseCajunCambodianCanadianCape VerdeanCarpatho RusynCelticCentral AmericanCentral American IndianCherokeeCheyenneChickasawChileanChineseChippewaChoctawColombianColvilleComancheCosta RicanCreeCreekCroatianCrowCubanCypriotCzechCzechoslovakianDanishDelawareDominicanDutchDutch West IndianEastern EuropeanEcuadorianEgyptianEnglishEstonianEthiopianEuropeanFijianFilipinoFinnishFrenchFrench American IndianFrench CanadianGermanGerman RussianGhanaianGreekGuamanian/ChamorroGuatemalanGuyaneseHaitianHmongHonduranHopiHoumaHungarianIcelanderIndian (Asian)IndonesianInupiatIranianIraqiIrishIroquoisIsraeliItalianJamaicanJapaneseKenyanKiowaKoreanLaotianLatvianLebaneseLiberianLithuanianLumbeeLuxembourgerMacedonianMalaysianMalteseMarshalleseMenomineeMexicanMexican American IndianMongolianMoroccanNative HawaiianNavajoNepaleseNew ZealanderNicaraguanNigerianNorthern EuropeanNorwegianOkinawanOsageOttawaPaiutePakistaniPalestinianPanamanianParaguayanPennsylvania GermanPeruvianPimaPolishPortuguesePotawatomiPuebloPuerto RicanPuget Sound SalishRomanianRussianSalvadoranSamoanScandinavianScotch-IrishScottishSeminoleSenegaleseSerbianShoshoneSierra LeoneanSiouxSlavicSlovakSloveneSomaliSouth AfricanSouth AmericanSouth American IndianSoviet UnionSpaniardSpanishSpanish AmericanSpanish American IndianSri LankanSubsaharan AfricanSudaneseSwedishSwissSyrianTaiwaneseThaiTlingit-HaidaTohono O'OdhamTonganTrinidadian and TobagonianTsimshianTurkishU.S. Virgin IslanderUgandanUkrainianUruguayanUteVenezuelanVietnameseWelshWest IndianYakamaYaquiYugoslavianYumanYup'ikZimbabwean
Immigration
NonimmigrantsImmigrantsAfghanistanAfricaAlbaniaArgentinaArmeniaAsiaAustraliaAustriaBahamasBangladeshBarbadosBelarusBelgiumBelizeBoliviaBosnia and HerzegovinaBrazilBulgariaBurma/MyanmarCabo VerdeCambodiaCameroonCanadaCaribbeanCentral AmericaChileChinaColombiaCongoCosta RicaCroatiaCubaCzechoslovakiaDenmarkDominicaDominican RepublicEastern AfricaEastern AsiaEastern EuropeEcuadorEgyptEl SalvadorEnglandEritreaEthiopiaEuropeFijiFranceGermanyGhanaGreeceGrenadaGuatemalaGuyanaHaitiHondurasHong KongHungaryIndiaIndonesiaIranIraqIrelandIsraelItalyJamaicaJapanJordanKazakhstanKenyaKoreaKuwaitLaosLatin AmericaLatviaLebanonLiberiaLithuaniaMalaysiaMexicoMicronesiaMiddle AfricaMoldovaMoroccoNepalNetherlandsNicaraguaNigeriaNorth AmericaNorth MacedoniaNorthern AfricaNorthern EuropeNorwayOceaniaPakistanPanamaPeruPhilippinesPolandPortugalRomaniaRussiaSaudi ArabiaScotlandSenegalSerbiaSierra LeoneSingaporeSomaliaSouth AfricaSouth AmericaSouth Central AsiaSouth Eastern AsiaSouthern EuropeSpainSri LankaSt. Vincent and the GrenadinesSudanSwedenSwitzerlandSyriaTaiwanThailandTrinidad and TobagoTurkeyUgandaUkraineUruguayUzbekistanVenezuelaVietnamWest IndiesWestern AfricaWestern AsiaWestern EuropeYemenZaireZimbabweAzores
Unemployment Among Ages 55 to 59 years
Income
Poverty
Unemployment
Labor Participation
Family Structure
Vehicle Availability
Education Level
Disability

Unemployment Among Ages 55 to 59 years Comparison

Jordanians

Yakama

Exceptional
Tragic
4.4%
UNEMPLOYMENT AMONG AGES 55 TO 59 YEARS
100.0/ 100
METRIC RATING
24th/ 347
METRIC RANK
8.9%
UNEMPLOYMENT AMONG AGES 55 TO 59 YEARS
0.0/ 100
METRIC RATING
343rd/ 347
METRIC RANK

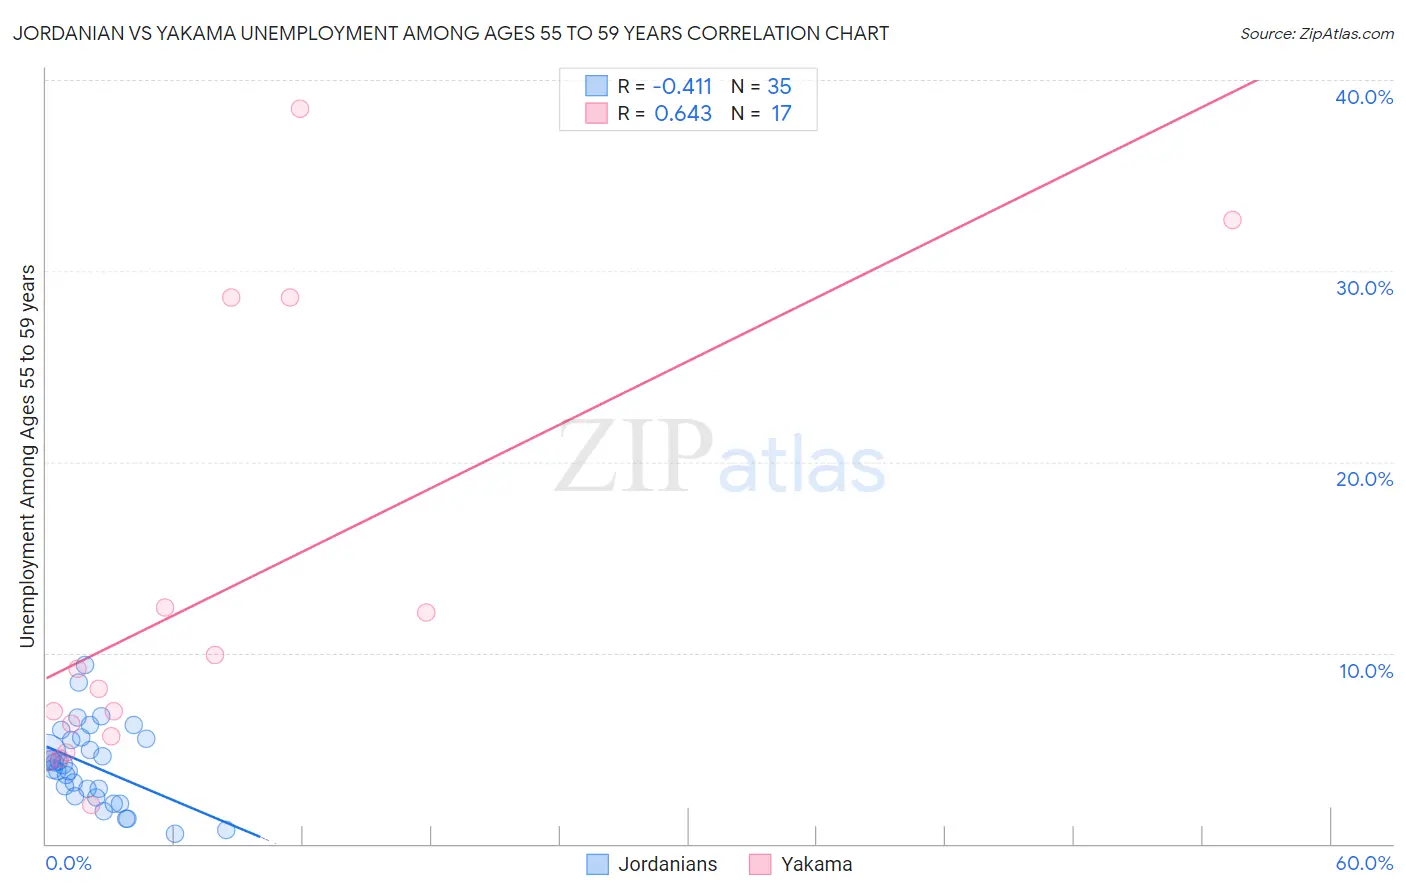
Jordanian vs Yakama Unemployment Among Ages 55 to 59 years Correlation Chart

The statistical analysis conducted on geographies consisting of 162,372,317 people shows a moderate negative correlation between the proportion of Jordanians and unemployment rate among population between the ages 55 and 59 in the United States with a correlation coefficient (R) of -0.411 and weighted average of 4.4%. Similarly, the statistical analysis conducted on geographies consisting of 19,170,351 people shows a significant positive correlation between the proportion of Yakama and unemployment rate among population between the ages 55 and 59 in the United States with a correlation coefficient (R) of 0.643 and weighted average of 8.9%, a difference of 101.0%.
Jordanian vs Yakama Unemployment Among Ages 55 to 59 years

Unemployment Among Ages 55 to 59 years Correlation Summary

MeasurementJordanianYakama
Minimum0.50%2.0%
Maximum9.4%38.5%
Range8.9%36.5%
Mean4.1%13.0%
Median4.2%8.1%
Interquartile 25% (IQ1)2.5%5.2%
Interquartile 75% (IQ3)5.5%20.5%
Interquartile Range (IQR)3.0%15.3%
Standard Deviation (Sample)2.1%11.4%
Standard Deviation (Population)2.0%11.1%

Similar Demographics by Unemployment Among Ages 55 to 59 years

Demographics Similar to Jordanians by Unemployment Among Ages 55 to 59 years

In terms of unemployment among ages 55 to 59 years, the demographic groups most similar to Jordanians are Immigrants from Eritrea (4.4%, a difference of 0.010%), Scandinavian (4.5%, a difference of 0.18%), Immigrants from Zimbabwe (4.5%, a difference of 0.19%), Immigrants from Eastern Africa (4.5%, a difference of 0.23%), and Palestinian (4.5%, a difference of 0.26%).
DemographicsRating | RankUnemployment Among Ages 55 to 59 years
Czechs
100.0
/100
|
#17
Exceptional
4.4%
Immigrants | Somalia
100.0
/100
|
#18
Exceptional
4.4%
Chinese
100.0
/100
|
#19
Exceptional
4.4%
Swedes
100.0
/100
|
#20
Exceptional
4.4%
Puget Sound Salish
100.0
/100
|
#21
Exceptional
4.4%
Immigrants | Burma/Myanmar
100.0
/100
|
#22
Exceptional
4.4%
Kenyans
100.0
/100
|
#23
Exceptional
4.4%
Jordanians
100.0
/100
|
#24
Exceptional
4.4%
Immigrants | Eritrea
100.0
/100
|
#25
Exceptional
4.4%
Scandinavians
99.9
/100
|
#26
Exceptional
4.5%
Immigrants | Zimbabwe
99.9
/100
|
#27
Exceptional
4.5%
Immigrants | Eastern Africa
99.9
/100
|
#28
Exceptional
4.5%
Palestinians
99.9
/100
|
#29
Exceptional
4.5%
Immigrants | Kenya
99.9
/100
|
#30
Exceptional
4.5%
Germans
99.9
/100
|
#31
Exceptional
4.5%

Demographics Similar to Yakama by Unemployment Among Ages 55 to 59 years

In terms of unemployment among ages 55 to 59 years, the demographic groups most similar to Yakama are Inupiat (9.0%, a difference of 1.2%), Tohono O'odham (9.3%, a difference of 4.3%), Hopi (8.1%, a difference of 10.0%), Menominee (10.5%, a difference of 18.0%), and Shoshone (7.4%, a difference of 21.1%).
DemographicsRating | RankUnemployment Among Ages 55 to 59 years
Pima
0.0
/100
|
#333
Tragic
6.6%
Pueblo
0.0
/100
|
#334
Tragic
6.7%
Colville
0.0
/100
|
#335
Tragic
6.7%
Navajo
0.0
/100
|
#336
Tragic
6.7%
Paiute
0.0
/100
|
#337
Tragic
6.8%
Immigrants | Yemen
0.0
/100
|
#338
Tragic
6.9%
Puerto Ricans
0.0
/100
|
#339
Tragic
7.0%
Alaskan Athabascans
0.0
/100
|
#340
Tragic
7.1%
Shoshone
0.0
/100
|
#341
Tragic
7.4%
Hopi
0.0
/100
|
#342
Tragic
8.1%
Yakama
0.0
/100
|
#343
Tragic
8.9%
Inupiat
0.0
/100
|
#344
Tragic
9.0%
Tohono O'odham
0.0
/100
|
#345
Tragic
9.3%
Menominee
0.0
/100
|
#346
Tragic
10.5%
Yup'ik
0.0
/100
|
#347
Tragic
13.9%