Jordanian vs Immigrants from El Salvador Unemployment Among Women with Children Under 18 years

COMPARE

Jordanian
Race
Ancestry
AfghanAfricanAlaska NativeAlaskan AthabascanAlbanianAleutAlsatianAmericanApacheArabArapahoArgentineanArmenianAssyrian/Chaldean/SyriacAustralianAustrianBahamianBangladeshiBarbadianBasqueBelgianBelizeanBermudanBhutaneseBlackfeetBolivianBrazilianBritishBritish West IndianBulgarianBurmeseCajunCambodianCanadianCape VerdeanCarpatho RusynCelticCentral AmericanCentral American IndianCherokeeCheyenneChickasawChileanChineseChippewaChoctawColombianColvilleComancheCosta RicanCreeCreekCroatianCrowCubanCypriotCzechCzechoslovakianDanishDelawareDominicanDutchDutch West IndianEastern EuropeanEcuadorianEgyptianEnglishEstonianEthiopianEuropeanFijianFilipinoFinnishFrenchFrench American IndianFrench CanadianGermanGerman RussianGhanaianGreekGuamanian/ChamorroGuatemalanGuyaneseHaitianHmongHonduranHopiHoumaHungarianIcelanderIndian (Asian)IndonesianInupiatIranianIraqiIrishIroquoisIsraeliItalianJamaicanJapaneseJordanianKenyanKiowaKoreanLaotianLatvianLebaneseLiberianLithuanianLumbeeLuxembourgerMacedonianMalaysianMalteseMarshalleseMenomineeMexicanMexican American IndianMongolianMoroccanNative HawaiianNavajoNepaleseNew ZealanderNicaraguanNigerianNorthern EuropeanNorwegianOkinawanOsageOttawaPaiutePakistaniPalestinianPanamanianParaguayanPennsylvania GermanPeruvianPimaPolishPortuguesePotawatomiPuebloPuerto RicanPuget Sound SalishRomanianRussianSalvadoranSamoanScandinavianScotch-IrishScottishSeminoleSenegaleseSerbianShoshoneSierra LeoneanSiouxSlavicSlovakSloveneSomaliSouth AfricanSouth AmericanSouth American IndianSoviet UnionSpaniardSpanishSpanish AmericanSpanish American IndianSri LankanSubsaharan AfricanSudaneseSwedishSwissSyrianTaiwaneseThaiTlingit-HaidaTohono O'OdhamTonganTrinidadian and TobagonianTsimshianTurkishU.S. Virgin IslanderUgandanUkrainianUruguayanUteVenezuelanVietnameseWelshWest IndianYakamaYaquiYugoslavianYumanYup'ikZimbabwean
Immigration
NonimmigrantsImmigrantsAfghanistanAfricaAlbaniaArgentinaArmeniaAsiaAustraliaAustriaBahamasBangladeshBarbadosBelarusBelgiumBelizeBoliviaBosnia and HerzegovinaBrazilBulgariaBurma/MyanmarCabo VerdeCambodiaCameroonCanadaCaribbeanCentral AmericaChileChinaColombiaCongoCosta RicaCroatiaCubaCzechoslovakiaDenmarkDominicaDominican RepublicEastern AfricaEastern AsiaEastern EuropeEcuadorEgyptEnglandEritreaEthiopiaEuropeFijiFranceGermanyGhanaGreeceGrenadaGuatemalaGuyanaHaitiHondurasHong KongHungaryIndiaIndonesiaIranIraqIrelandIsraelItalyJamaicaJapanJordanKazakhstanKenyaKoreaKuwaitLaosLatin AmericaLatviaLebanonLiberiaLithuaniaMalaysiaMexicoMicronesiaMiddle AfricaMoldovaMoroccoNepalNetherlandsNicaraguaNigeriaNorth AmericaNorth MacedoniaNorthern AfricaNorthern EuropeNorwayOceaniaPakistanPanamaPeruPhilippinesPolandPortugalRomaniaRussiaSaudi ArabiaScotlandSenegalSerbiaSierra LeoneSingaporeSomaliaSouth AfricaSouth AmericaSouth Central AsiaSouth Eastern AsiaSouthern EuropeSpainSri LankaSt. Vincent and the GrenadinesSudanSwedenSwitzerlandSyriaTaiwanThailandTrinidad and TobagoTurkeyUgandaUkraineUruguayUzbekistanVenezuelaVietnamWest IndiesWestern AfricaWestern AsiaWestern EuropeYemenZaireZimbabweAzores
Immigrants from El Salvador
Race
Ancestry
AfghanAfricanAlaska NativeAlaskan AthabascanAlbanianAleutAlsatianAmericanApacheArabArapahoArgentineanArmenianAssyrian/Chaldean/SyriacAustralianAustrianBahamianBangladeshiBarbadianBasqueBelgianBelizeanBermudanBhutaneseBlackfeetBolivianBrazilianBritishBritish West IndianBulgarianBurmeseCajunCambodianCanadianCape VerdeanCarpatho RusynCelticCentral AmericanCentral American IndianCherokeeCheyenneChickasawChileanChineseChippewaChoctawColombianColvilleComancheCosta RicanCreeCreekCroatianCrowCubanCypriotCzechCzechoslovakianDanishDelawareDominicanDutchDutch West IndianEastern EuropeanEcuadorianEgyptianEnglishEstonianEthiopianEuropeanFijianFilipinoFinnishFrenchFrench American IndianFrench CanadianGermanGerman RussianGhanaianGreekGuamanian/ChamorroGuatemalanGuyaneseHaitianHmongHonduranHopiHoumaHungarianIcelanderIndian (Asian)IndonesianInupiatIranianIraqiIrishIroquoisIsraeliItalianJamaicanJapaneseKenyanKiowaKoreanLaotianLatvianLebaneseLiberianLithuanianLumbeeLuxembourgerMacedonianMalaysianMalteseMarshalleseMenomineeMexicanMexican American IndianMongolianMoroccanNative HawaiianNavajoNepaleseNew ZealanderNicaraguanNigerianNorthern EuropeanNorwegianOkinawanOsageOttawaPaiutePakistaniPalestinianPanamanianParaguayanPennsylvania GermanPeruvianPimaPolishPortuguesePotawatomiPuebloPuerto RicanPuget Sound SalishRomanianRussianSalvadoranSamoanScandinavianScotch-IrishScottishSeminoleSenegaleseSerbianShoshoneSierra LeoneanSiouxSlavicSlovakSloveneSomaliSouth AfricanSouth AmericanSouth American IndianSoviet UnionSpaniardSpanishSpanish AmericanSpanish American IndianSri LankanSubsaharan AfricanSudaneseSwedishSwissSyrianTaiwaneseThaiTlingit-HaidaTohono O'OdhamTonganTrinidadian and TobagonianTsimshianTurkishU.S. Virgin IslanderUgandanUkrainianUruguayanUteVenezuelanVietnameseWelshWest IndianYakamaYaquiYugoslavianYumanYup'ikZimbabwean
Immigration
NonimmigrantsImmigrantsAfghanistanAfricaAlbaniaArgentinaArmeniaAsiaAustraliaAustriaBahamasBangladeshBarbadosBelarusBelgiumBelizeBoliviaBosnia and HerzegovinaBrazilBulgariaBurma/MyanmarCabo VerdeCambodiaCameroonCanadaCaribbeanCentral AmericaChileChinaColombiaCongoCosta RicaCroatiaCubaCzechoslovakiaDenmarkDominicaDominican RepublicEastern AfricaEastern AsiaEastern EuropeEcuadorEgyptEl SalvadorEnglandEritreaEthiopiaEuropeFijiFranceGermanyGhanaGreeceGrenadaGuatemalaGuyanaHaitiHondurasHong KongHungaryIndiaIndonesiaIranIraqIrelandIsraelItalyJamaicaJapanJordanKazakhstanKenyaKoreaKuwaitLaosLatin AmericaLatviaLebanonLiberiaLithuaniaMalaysiaMexicoMicronesiaMiddle AfricaMoldovaMoroccoNepalNetherlandsNicaraguaNigeriaNorth AmericaNorth MacedoniaNorthern AfricaNorthern EuropeNorwayOceaniaPakistanPanamaPeruPhilippinesPolandPortugalRomaniaRussiaSaudi ArabiaScotlandSenegalSerbiaSierra LeoneSingaporeSomaliaSouth AfricaSouth AmericaSouth Central AsiaSouth Eastern AsiaSouthern EuropeSpainSri LankaSt. Vincent and the GrenadinesSudanSwedenSwitzerlandSyriaTaiwanThailandTrinidad and TobagoTurkeyUgandaUkraineUruguayUzbekistanVenezuelaVietnamWest IndiesWestern AfricaWestern AsiaWestern EuropeYemenZaireZimbabweAzores
Unemployment Among Women with Children Under 18 years
Income
Poverty
Unemployment
Labor Participation
Family Structure
Vehicle Availability
Education Level
Disability

Unemployment Among Women with Children Under 18 years Comparison

Jordanians

Immigrants from El Salvador

Good
Tragic
5.3%
UNEMPLOYMENT AMONG WOMEN WITH CHILDREN UNDER 18 YEARS
78.8/ 100
METRIC RATING
137th/ 347
METRIC RANK
6.3%
UNEMPLOYMENT AMONG WOMEN WITH CHILDREN UNDER 18 YEARS
0.0/ 100
METRIC RATING
281st/ 347
METRIC RANK

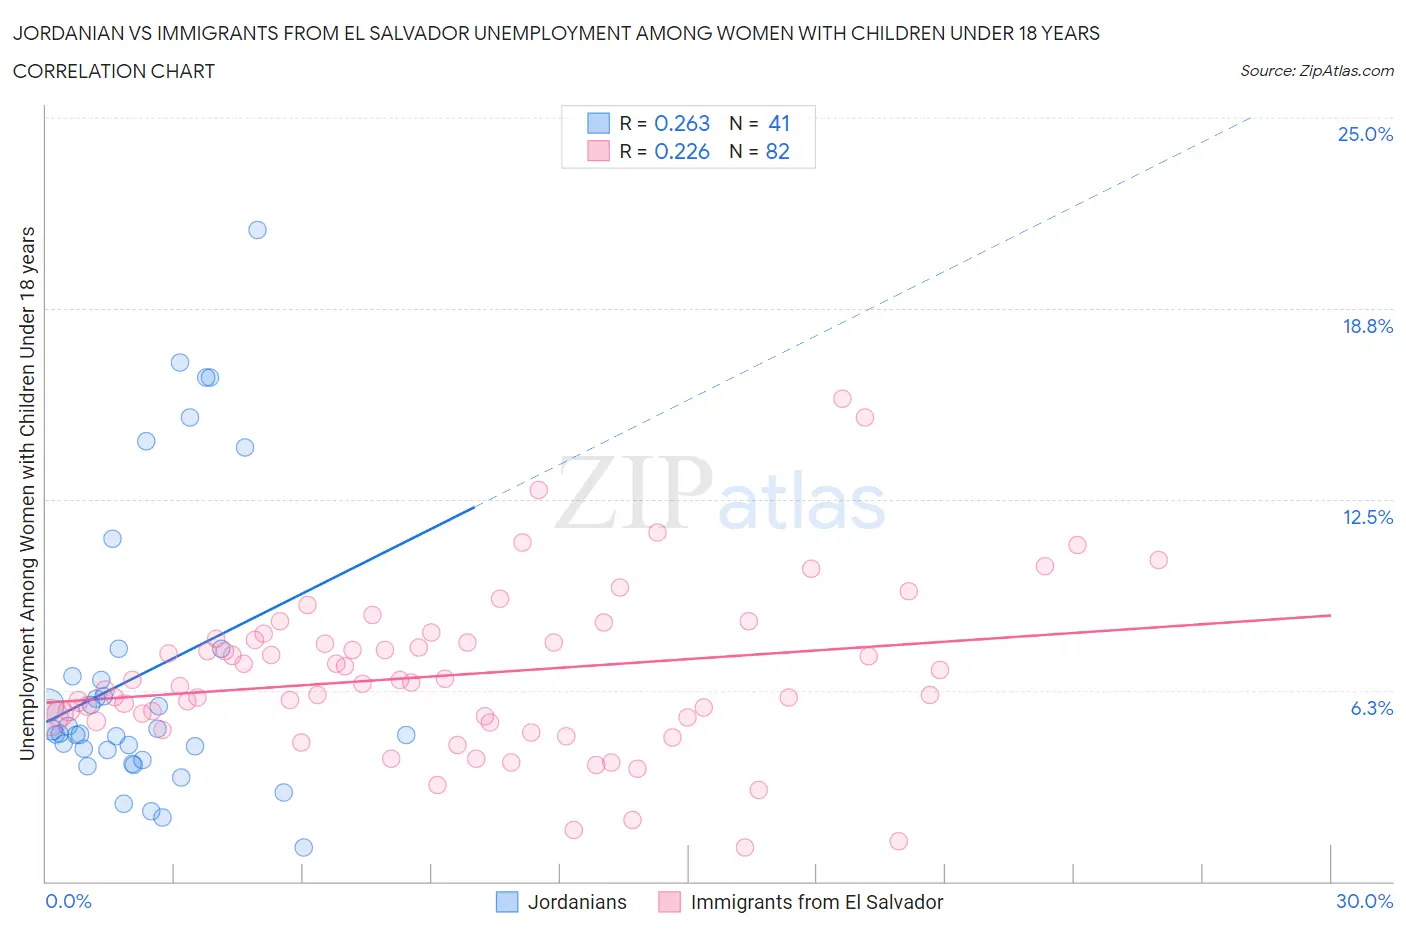
Jordanian vs Immigrants from El Salvador Unemployment Among Women with Children Under 18 years Correlation Chart

The statistical analysis conducted on geographies consisting of 164,217,063 people shows a weak positive correlation between the proportion of Jordanians and unemployment rate among women with children under the age of 18 in the United States with a correlation coefficient (R) of 0.263 and weighted average of 5.3%. Similarly, the statistical analysis conducted on geographies consisting of 348,177,746 people shows a weak positive correlation between the proportion of Immigrants from El Salvador and unemployment rate among women with children under the age of 18 in the United States with a correlation coefficient (R) of 0.226 and weighted average of 6.3%, a difference of 18.4%.
Jordanian vs Immigrants from El Salvador Unemployment Among Women with Children Under 18 years

Unemployment Among Women with Children Under 18 years Correlation Summary

MeasurementJordanianImmigrants from El Salvador
Minimum1.1%1.1%
Maximum21.3%15.8%
Range20.2%14.7%
Mean6.8%6.8%
Median4.8%6.5%
Interquartile 25% (IQ1)4.1%5.3%
Interquartile 75% (IQ3)7.2%7.9%
Interquartile Range (IQR)3.0%2.6%
Standard Deviation (Sample)4.8%2.7%
Standard Deviation (Population)4.8%2.7%

Similar Demographics by Unemployment Among Women with Children Under 18 years

Demographics Similar to Jordanians by Unemployment Among Women with Children Under 18 years

In terms of unemployment among women with children under 18 years, the demographic groups most similar to Jordanians are Argentinean (5.3%, a difference of 0.010%), Immigrants from Ukraine (5.3%, a difference of 0.030%), Immigrants from Jordan (5.3%, a difference of 0.070%), New Zealander (5.3%, a difference of 0.12%), and Slovak (5.3%, a difference of 0.19%).
DemographicsRating | RankUnemployment Among Women with Children Under 18 years
Immigrants | Austria
82.1
/100
|
#130
Excellent
5.3%
Immigrants | Israel
81.9
/100
|
#131
Excellent
5.3%
Immigrants | Ethiopia
81.4
/100
|
#132
Excellent
5.3%
Ethiopians
80.7
/100
|
#133
Excellent
5.3%
Slovaks
80.5
/100
|
#134
Excellent
5.3%
New Zealanders
79.9
/100
|
#135
Good
5.3%
Immigrants | Jordan
79.5
/100
|
#136
Good
5.3%
Jordanians
78.8
/100
|
#137
Good
5.3%
Argentineans
78.8
/100
|
#138
Good
5.3%
Immigrants | Ukraine
78.5
/100
|
#139
Good
5.3%
Immigrants | Norway
76.2
/100
|
#140
Good
5.3%
Venezuelans
76.0
/100
|
#141
Good
5.3%
Immigrants | Venezuela
75.4
/100
|
#142
Good
5.3%
Chileans
75.0
/100
|
#143
Good
5.3%
Immigrants | England
74.9
/100
|
#144
Good
5.3%

Demographics Similar to Immigrants from El Salvador by Unemployment Among Women with Children Under 18 years

In terms of unemployment among women with children under 18 years, the demographic groups most similar to Immigrants from El Salvador are Immigrants from St. Vincent and the Grenadines (6.3%, a difference of 0.010%), Guatemalan (6.3%, a difference of 0.16%), West Indian (6.3%, a difference of 0.19%), Immigrants from Grenada (6.3%, a difference of 0.23%), and Bahamian (6.3%, a difference of 0.38%).
DemographicsRating | RankUnemployment Among Women with Children Under 18 years
Senegalese
0.0
/100
|
#274
Tragic
6.2%
Dutch West Indians
0.0
/100
|
#275
Tragic
6.2%
Immigrants | Ghana
0.0
/100
|
#276
Tragic
6.2%
Mexican American Indians
0.0
/100
|
#277
Tragic
6.2%
Immigrants | Barbados
0.0
/100
|
#278
Tragic
6.2%
Immigrants | Portugal
0.0
/100
|
#279
Tragic
6.3%
Guatemalans
0.0
/100
|
#280
Tragic
6.3%
Immigrants | El Salvador
0.0
/100
|
#281
Tragic
6.3%
Immigrants | St. Vincent and the Grenadines
0.0
/100
|
#282
Tragic
6.3%
West Indians
0.0
/100
|
#283
Tragic
6.3%
Immigrants | Grenada
0.0
/100
|
#284
Tragic
6.3%
Bahamians
0.0
/100
|
#285
Tragic
6.3%
Alaskan Athabascans
0.0
/100
|
#286
Tragic
6.3%
Kiowa
0.0
/100
|
#287
Tragic
6.3%
Cree
0.0
/100
|
#288
Tragic
6.3%