Japanese vs Immigrants from El Salvador Unemployment Among Ages 65 to 74 years

COMPARE

Japanese
Race
Ancestry
AfghanAfricanAlaska NativeAlaskan AthabascanAlbanianAleutAlsatianAmericanApacheArabArapahoArgentineanArmenianAssyrian/Chaldean/SyriacAustralianAustrianBahamianBangladeshiBarbadianBasqueBelgianBelizeanBermudanBhutaneseBlackfeetBolivianBrazilianBritishBritish West IndianBulgarianBurmeseCajunCambodianCanadianCape VerdeanCarpatho RusynCelticCentral AmericanCentral American IndianCherokeeCheyenneChickasawChileanChineseChippewaChoctawColombianColvilleComancheCosta RicanCreeCreekCroatianCrowCubanCypriotCzechCzechoslovakianDanishDelawareDominicanDutchDutch West IndianEastern EuropeanEcuadorianEgyptianEnglishEstonianEthiopianEuropeanFijianFilipinoFinnishFrenchFrench American IndianFrench CanadianGermanGerman RussianGhanaianGreekGuamanian/ChamorroGuatemalanGuyaneseHaitianHmongHonduranHopiHoumaHungarianIcelanderIndian (Asian)IndonesianInupiatIranianIraqiIrishIroquoisIsraeliItalianJamaicanJapaneseJordanianKenyanKiowaKoreanLaotianLatvianLebaneseLiberianLithuanianLumbeeLuxembourgerMacedonianMalaysianMalteseMarshalleseMenomineeMexicanMexican American IndianMongolianMoroccanNative HawaiianNavajoNepaleseNew ZealanderNicaraguanNigerianNorthern EuropeanNorwegianOkinawanOsageOttawaPaiutePakistaniPalestinianPanamanianParaguayanPennsylvania GermanPeruvianPimaPolishPortuguesePotawatomiPuebloPuerto RicanPuget Sound SalishRomanianRussianSalvadoranSamoanScandinavianScotch-IrishScottishSeminoleSenegaleseSerbianShoshoneSierra LeoneanSiouxSlavicSlovakSloveneSomaliSouth AfricanSouth AmericanSouth American IndianSoviet UnionSpaniardSpanishSpanish AmericanSpanish American IndianSri LankanSubsaharan AfricanSudaneseSwedishSwissSyrianTaiwaneseThaiTlingit-HaidaTohono O'OdhamTonganTrinidadian and TobagonianTsimshianTurkishU.S. Virgin IslanderUgandanUkrainianUruguayanUteVenezuelanVietnameseWelshWest IndianYakamaYaquiYugoslavianYumanYup'ikZimbabwean
Immigration
NonimmigrantsImmigrantsAfghanistanAfricaAlbaniaArgentinaArmeniaAsiaAustraliaAustriaBahamasBangladeshBarbadosBelarusBelgiumBelizeBoliviaBosnia and HerzegovinaBrazilBulgariaBurma/MyanmarCabo VerdeCambodiaCameroonCanadaCaribbeanCentral AmericaChileChinaColombiaCongoCosta RicaCroatiaCubaCzechoslovakiaDenmarkDominicaDominican RepublicEastern AfricaEastern AsiaEastern EuropeEcuadorEgyptEnglandEritreaEthiopiaEuropeFijiFranceGermanyGhanaGreeceGrenadaGuatemalaGuyanaHaitiHondurasHong KongHungaryIndiaIndonesiaIranIraqIrelandIsraelItalyJamaicaJapanJordanKazakhstanKenyaKoreaKuwaitLaosLatin AmericaLatviaLebanonLiberiaLithuaniaMalaysiaMexicoMicronesiaMiddle AfricaMoldovaMoroccoNepalNetherlandsNicaraguaNigeriaNorth AmericaNorth MacedoniaNorthern AfricaNorthern EuropeNorwayOceaniaPakistanPanamaPeruPhilippinesPolandPortugalRomaniaRussiaSaudi ArabiaScotlandSenegalSerbiaSierra LeoneSingaporeSomaliaSouth AfricaSouth AmericaSouth Central AsiaSouth Eastern AsiaSouthern EuropeSpainSri LankaSt. Vincent and the GrenadinesSudanSwedenSwitzerlandSyriaTaiwanThailandTrinidad and TobagoTurkeyUgandaUkraineUruguayUzbekistanVenezuelaVietnamWest IndiesWestern AfricaWestern AsiaWestern EuropeYemenZaireZimbabweAzores
Immigrants from El Salvador
Race
Ancestry
AfghanAfricanAlaska NativeAlaskan AthabascanAlbanianAleutAlsatianAmericanApacheArabArapahoArgentineanArmenianAssyrian/Chaldean/SyriacAustralianAustrianBahamianBangladeshiBarbadianBasqueBelgianBelizeanBermudanBhutaneseBlackfeetBolivianBrazilianBritishBritish West IndianBulgarianBurmeseCajunCambodianCanadianCape VerdeanCarpatho RusynCelticCentral AmericanCentral American IndianCherokeeCheyenneChickasawChileanChineseChippewaChoctawColombianColvilleComancheCosta RicanCreeCreekCroatianCrowCubanCypriotCzechCzechoslovakianDanishDelawareDominicanDutchDutch West IndianEastern EuropeanEcuadorianEgyptianEnglishEstonianEthiopianEuropeanFijianFilipinoFinnishFrenchFrench American IndianFrench CanadianGermanGerman RussianGhanaianGreekGuamanian/ChamorroGuatemalanGuyaneseHaitianHmongHonduranHopiHoumaHungarianIcelanderIndian (Asian)IndonesianInupiatIranianIraqiIrishIroquoisIsraeliItalianJamaicanJordanianKenyanKiowaKoreanLaotianLatvianLebaneseLiberianLithuanianLumbeeLuxembourgerMacedonianMalaysianMalteseMarshalleseMenomineeMexicanMexican American IndianMongolianMoroccanNative HawaiianNavajoNepaleseNew ZealanderNicaraguanNigerianNorthern EuropeanNorwegianOkinawanOsageOttawaPaiutePakistaniPalestinianPanamanianParaguayanPennsylvania GermanPeruvianPimaPolishPortuguesePotawatomiPuebloPuerto RicanPuget Sound SalishRomanianRussianSalvadoranSamoanScandinavianScotch-IrishScottishSeminoleSenegaleseSerbianShoshoneSierra LeoneanSiouxSlavicSlovakSloveneSomaliSouth AfricanSouth AmericanSouth American IndianSoviet UnionSpaniardSpanishSpanish AmericanSpanish American IndianSri LankanSubsaharan AfricanSudaneseSwedishSwissSyrianTaiwaneseThaiTlingit-HaidaTohono O'OdhamTonganTrinidadian and TobagonianTsimshianTurkishU.S. Virgin IslanderUgandanUkrainianUruguayanUteVenezuelanVietnameseWelshWest IndianYakamaYaquiYugoslavianYumanYup'ikZimbabwean
Immigration
NonimmigrantsImmigrantsAfghanistanAfricaAlbaniaArgentinaArmeniaAsiaAustraliaAustriaBahamasBangladeshBarbadosBelarusBelgiumBelizeBoliviaBosnia and HerzegovinaBrazilBulgariaBurma/MyanmarCabo VerdeCambodiaCameroonCanadaCaribbeanCentral AmericaChileChinaColombiaCongoCosta RicaCroatiaCubaCzechoslovakiaDenmarkDominicaDominican RepublicEastern AfricaEastern AsiaEastern EuropeEcuadorEgyptEl SalvadorEnglandEritreaEthiopiaEuropeFijiFranceGermanyGhanaGreeceGrenadaGuatemalaGuyanaHaitiHondurasHong KongHungaryIndiaIndonesiaIranIraqIrelandIsraelItalyJamaicaJapanJordanKazakhstanKenyaKoreaKuwaitLaosLatin AmericaLatviaLebanonLiberiaLithuaniaMalaysiaMexicoMicronesiaMiddle AfricaMoldovaMoroccoNepalNetherlandsNicaraguaNigeriaNorth AmericaNorth MacedoniaNorthern AfricaNorthern EuropeNorwayOceaniaPakistanPanamaPeruPhilippinesPolandPortugalRomaniaRussiaSaudi ArabiaScotlandSenegalSerbiaSierra LeoneSingaporeSomaliaSouth AfricaSouth AmericaSouth Central AsiaSouth Eastern AsiaSouthern EuropeSpainSri LankaSt. Vincent and the GrenadinesSudanSwedenSwitzerlandSyriaTaiwanThailandTrinidad and TobagoTurkeyUgandaUkraineUruguayUzbekistanVenezuelaVietnamWest IndiesWestern AfricaWestern AsiaWestern EuropeYemenZaireZimbabweAzores
Unemployment Among Ages 65 to 74 years
Income
Poverty
Unemployment
Labor Participation
Family Structure
Vehicle Availability
Education Level
Disability

Unemployment Among Ages 65 to 74 years Comparison

Japanese

Immigrants from El Salvador

Exceptional
Tragic
5.2%
UNEMPLOYMENT AMONG AGES 65 TO 74 YEARS
96.4/ 100
METRIC RATING
100th/ 347
METRIC RANK
5.9%
UNEMPLOYMENT AMONG AGES 65 TO 74 YEARS
0.0/ 100
METRIC RATING
316th/ 347
METRIC RANK

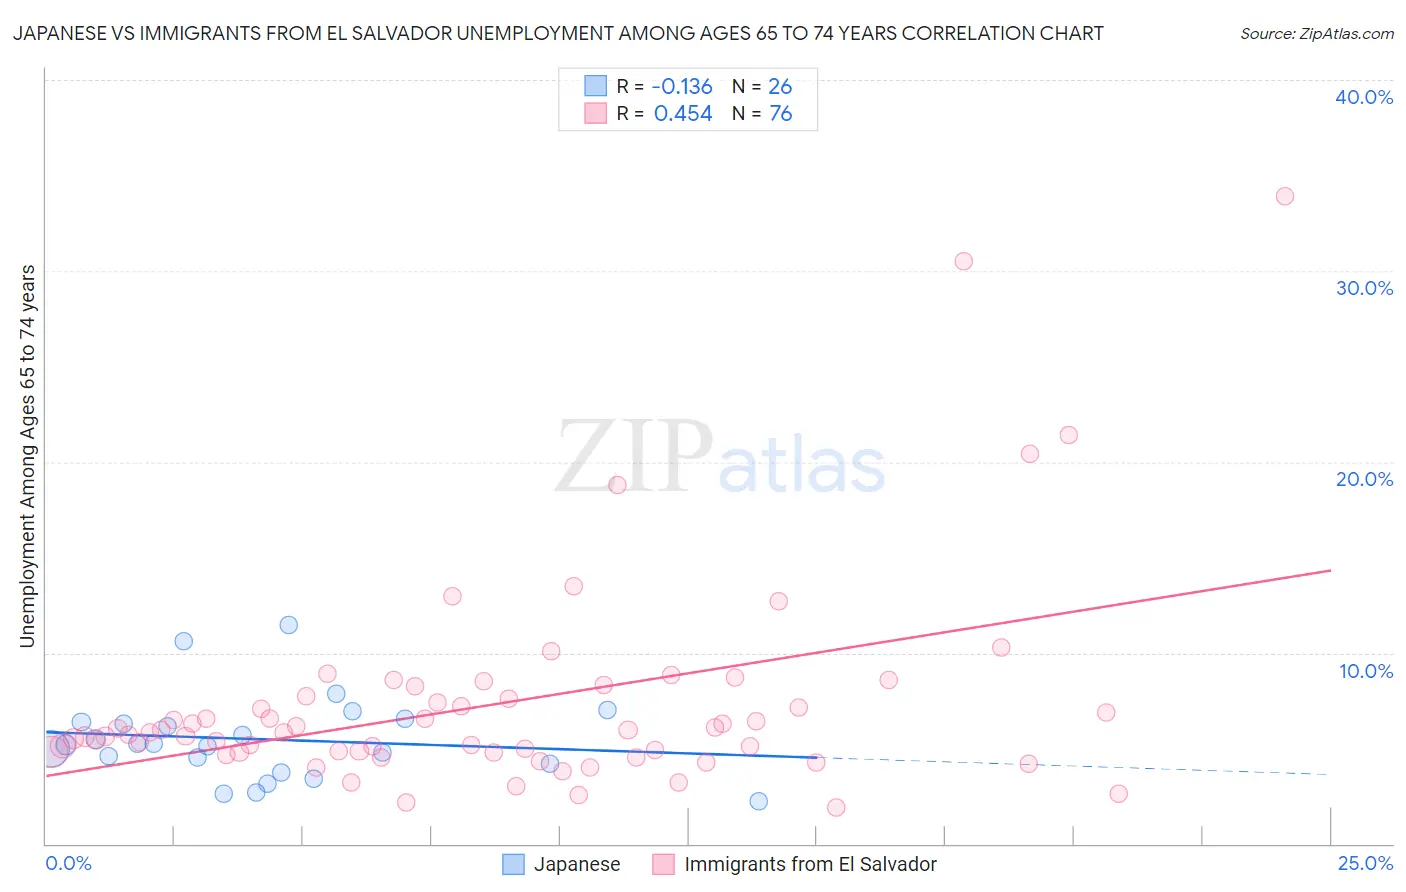
Japanese vs Immigrants from El Salvador Unemployment Among Ages 65 to 74 years Correlation Chart

The statistical analysis conducted on geographies consisting of 230,153,386 people shows a poor negative correlation between the proportion of Japanese and unemployment rate among population between the ages 65 and 74 in the United States with a correlation coefficient (R) of -0.136 and weighted average of 5.2%. Similarly, the statistical analysis conducted on geographies consisting of 318,434,053 people shows a moderate positive correlation between the proportion of Immigrants from El Salvador and unemployment rate among population between the ages 65 and 74 in the United States with a correlation coefficient (R) of 0.454 and weighted average of 5.9%, a difference of 13.0%.
Japanese vs Immigrants from El Salvador Unemployment Among Ages 65 to 74 years

Unemployment Among Ages 65 to 74 years Correlation Summary

MeasurementJapaneseImmigrants from El Salvador
Minimum2.2%1.9%
Maximum11.5%33.9%
Range9.3%32.0%
Mean5.5%7.3%
Median5.2%5.8%
Interquartile 25% (IQ1)4.2%4.8%
Interquartile 75% (IQ3)6.4%7.7%
Interquartile Range (IQR)2.2%2.9%
Standard Deviation (Sample)2.2%5.5%
Standard Deviation (Population)2.1%5.4%

Similar Demographics by Unemployment Among Ages 65 to 74 years

Demographics Similar to Japanese by Unemployment Among Ages 65 to 74 years

In terms of unemployment among ages 65 to 74 years, the demographic groups most similar to Japanese are Immigrants from Cambodia (5.2%, a difference of 0.0%), Burmese (5.2%, a difference of 0.020%), Welsh (5.2%, a difference of 0.030%), Senegalese (5.2%, a difference of 0.040%), and Immigrants from Lithuania (5.2%, a difference of 0.10%).
DemographicsRating | RankUnemployment Among Ages 65 to 74 years
Immigrants | Netherlands
97.1
/100
|
#93
Exceptional
5.2%
South Africans
97.1
/100
|
#94
Exceptional
5.2%
Serbians
97.0
/100
|
#95
Exceptional
5.2%
Immigrants | Thailand
97.0
/100
|
#96
Exceptional
5.2%
Senegalese
96.5
/100
|
#97
Exceptional
5.2%
Welsh
96.5
/100
|
#98
Exceptional
5.2%
Burmese
96.4
/100
|
#99
Exceptional
5.2%
Japanese
96.4
/100
|
#100
Exceptional
5.2%
Immigrants | Cambodia
96.3
/100
|
#101
Exceptional
5.2%
Immigrants | Lithuania
95.9
/100
|
#102
Exceptional
5.2%
Immigrants | Vietnam
95.6
/100
|
#103
Exceptional
5.2%
Yugoslavians
95.5
/100
|
#104
Exceptional
5.2%
Iranians
95.2
/100
|
#105
Exceptional
5.2%
Malaysians
95.1
/100
|
#106
Exceptional
5.2%
Austrians
94.5
/100
|
#107
Exceptional
5.2%

Demographics Similar to Immigrants from El Salvador by Unemployment Among Ages 65 to 74 years

In terms of unemployment among ages 65 to 74 years, the demographic groups most similar to Immigrants from El Salvador are Immigrants from Guatemala (5.9%, a difference of 0.32%), Immigrants from Venezuela (5.9%, a difference of 0.33%), Immigrants from Central America (5.9%, a difference of 0.49%), Vietnamese (5.9%, a difference of 0.51%), and Hispanic or Latino (5.9%, a difference of 0.70%).
DemographicsRating | RankUnemployment Among Ages 65 to 74 years
Immigrants | Ecuador
0.0
/100
|
#309
Tragic
5.8%
Immigrants | Bangladesh
0.0
/100
|
#310
Tragic
5.9%
Venezuelans
0.0
/100
|
#311
Tragic
5.9%
Hispanics or Latinos
0.0
/100
|
#312
Tragic
5.9%
Vietnamese
0.0
/100
|
#313
Tragic
5.9%
Immigrants | Venezuela
0.0
/100
|
#314
Tragic
5.9%
Immigrants | Guatemala
0.0
/100
|
#315
Tragic
5.9%
Immigrants | El Salvador
0.0
/100
|
#316
Tragic
5.9%
Immigrants | Central America
0.0
/100
|
#317
Tragic
5.9%
Zimbabweans
0.0
/100
|
#318
Tragic
5.9%
Aleuts
0.0
/100
|
#319
Tragic
5.9%
Immigrants | Bahamas
0.0
/100
|
#320
Tragic
5.9%
Immigrants | Dominica
0.0
/100
|
#321
Tragic
6.0%
Immigrants | Mexico
0.0
/100
|
#322
Tragic
6.0%
Delaware
0.0
/100
|
#323
Tragic
6.0%