Jamaican vs Immigrants from Denmark Unemployment Among Ages 30 to 34 years
COMPARE
Jamaican
Immigrants from Denmark
Unemployment Among Ages 30 to 34 years
Unemployment Among Ages 30 to 34 years Comparison
Jamaicans
Immigrants from Denmark
6.5%
UNEMPLOYMENT AMONG AGES 30 TO 34 YEARS
0.0/ 100
METRIC RATING
291st/ 347
METRIC RANK
5.5%
UNEMPLOYMENT AMONG AGES 30 TO 34 YEARS
43.4/ 100
METRIC RATING
182nd/ 347
METRIC RANK
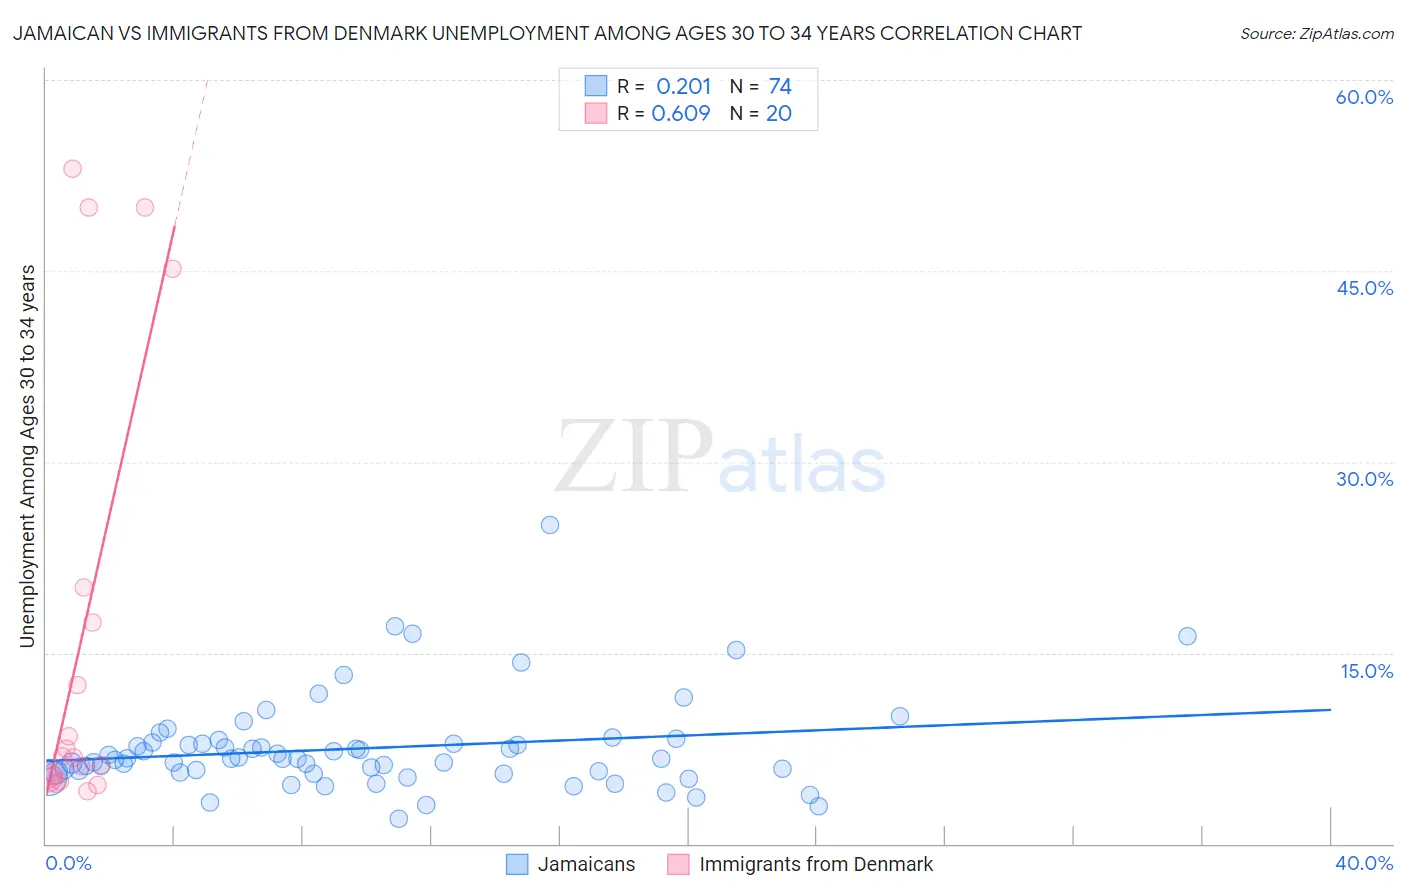
Jamaican vs Immigrants from Denmark Unemployment Among Ages 30 to 34 years Correlation Chart
The statistical analysis conducted on geographies consisting of 350,762,297 people shows a weak positive correlation between the proportion of Jamaicans and unemployment rate among population between the ages 30 and 34 in the United States with a correlation coefficient (R) of 0.201 and weighted average of 6.5%. Similarly, the statistical analysis conducted on geographies consisting of 132,115,790 people shows a significant positive correlation between the proportion of Immigrants from Denmark and unemployment rate among population between the ages 30 and 34 in the United States with a correlation coefficient (R) of 0.609 and weighted average of 5.5%, a difference of 18.1%.
Unemployment Among Ages 30 to 34 years Correlation Summary
| Measurement | Jamaican | Immigrants from Denmark |
| Minimum | 2.0% | 4.1% |
| Maximum | 25.0% | 53.1% |
| Range | 23.0% | 48.9% |
| Mean | 7.5% | 16.2% |
| Median | 6.7% | 6.8% |
| Interquartile 25% (IQ1) | 5.6% | 5.2% |
| Interquartile 75% (IQ3) | 7.9% | 18.7% |
| Interquartile Range (IQR) | 2.3% | 13.5% |
| Standard Deviation (Sample) | 3.7% | 17.7% |
| Standard Deviation (Population) | 3.7% | 17.2% |
Similar Demographics by Unemployment Among Ages 30 to 34 years
Demographics Similar to Jamaicans by Unemployment Among Ages 30 to 34 years
In terms of unemployment among ages 30 to 34 years, the demographic groups most similar to Jamaicans are Vietnamese (6.5%, a difference of 0.27%), Immigrants from Trinidad and Tobago (6.5%, a difference of 0.29%), West Indian (6.5%, a difference of 0.35%), Menominee (6.4%, a difference of 0.66%), and Senegalese (6.4%, a difference of 0.71%).
| Demographics | Rating | Rank | Unemployment Among Ages 30 to 34 years |
| Immigrants | Bangladesh | 0.0 /100 | #284 | Tragic 6.4% |
| Choctaw | 0.0 /100 | #285 | Tragic 6.4% |
| Central American Indians | 0.0 /100 | #286 | Tragic 6.4% |
| Immigrants | West Indies | 0.0 /100 | #287 | Tragic 6.4% |
| Senegalese | 0.0 /100 | #288 | Tragic 6.4% |
| Menominee | 0.0 /100 | #289 | Tragic 6.4% |
| Immigrants | Trinidad and Tobago | 0.0 /100 | #290 | Tragic 6.5% |
| Jamaicans | 0.0 /100 | #291 | Tragic 6.5% |
| Vietnamese | 0.0 /100 | #292 | Tragic 6.5% |
| West Indians | 0.0 /100 | #293 | Tragic 6.5% |
| Barbadians | 0.0 /100 | #294 | Tragic 6.5% |
| Trinidadians and Tobagonians | 0.0 /100 | #295 | Tragic 6.5% |
| Immigrants | Jamaica | 0.0 /100 | #296 | Tragic 6.5% |
| Creek | 0.0 /100 | #297 | Tragic 6.6% |
| Immigrants | Barbados | 0.0 /100 | #298 | Tragic 6.6% |
Demographics Similar to Immigrants from Denmark by Unemployment Among Ages 30 to 34 years
In terms of unemployment among ages 30 to 34 years, the demographic groups most similar to Immigrants from Denmark are Immigrants from Lebanon (5.5%, a difference of 0.010%), Hungarian (5.5%, a difference of 0.020%), Malaysian (5.5%, a difference of 0.11%), Italian (5.5%, a difference of 0.15%), and Costa Rican (5.5%, a difference of 0.23%).
| Demographics | Rating | Rank | Unemployment Among Ages 30 to 34 years |
| Afghans | 49.6 /100 | #175 | Average 5.5% |
| Immigrants | Peru | 48.0 /100 | #176 | Average 5.5% |
| Immigrants | Ukraine | 47.7 /100 | #177 | Average 5.5% |
| Macedonians | 47.1 /100 | #178 | Average 5.5% |
| Costa Ricans | 46.7 /100 | #179 | Average 5.5% |
| Italians | 45.5 /100 | #180 | Average 5.5% |
| Immigrants | Lebanon | 43.5 /100 | #181 | Average 5.5% |
| Immigrants | Denmark | 43.4 /100 | #182 | Average 5.5% |
| Hungarians | 43.1 /100 | #183 | Average 5.5% |
| Malaysians | 41.8 /100 | #184 | Average 5.5% |
| Immigrants | Western Europe | 39.1 /100 | #185 | Fair 5.5% |
| Canadians | 38.2 /100 | #186 | Fair 5.5% |
| Immigrants | Western Asia | 38.2 /100 | #187 | Fair 5.5% |
| Immigrants | Norway | 36.1 /100 | #188 | Fair 5.5% |
| Immigrants | England | 35.7 /100 | #189 | Fair 5.5% |