Jamaican vs Cajun Unemployment Among Ages 45 to 54 years
COMPARE
Jamaican
Cajun
Unemployment Among Ages 45 to 54 years
Unemployment Among Ages 45 to 54 years Comparison
Jamaicans
Cajuns
5.3%
UNEMPLOYMENT AMONG AGES 45 TO 54 YEARS
0.0/ 100
METRIC RATING
295th/ 347
METRIC RANK
5.0%
UNEMPLOYMENT AMONG AGES 45 TO 54 YEARS
0.0/ 100
METRIC RATING
271st/ 347
METRIC RANK
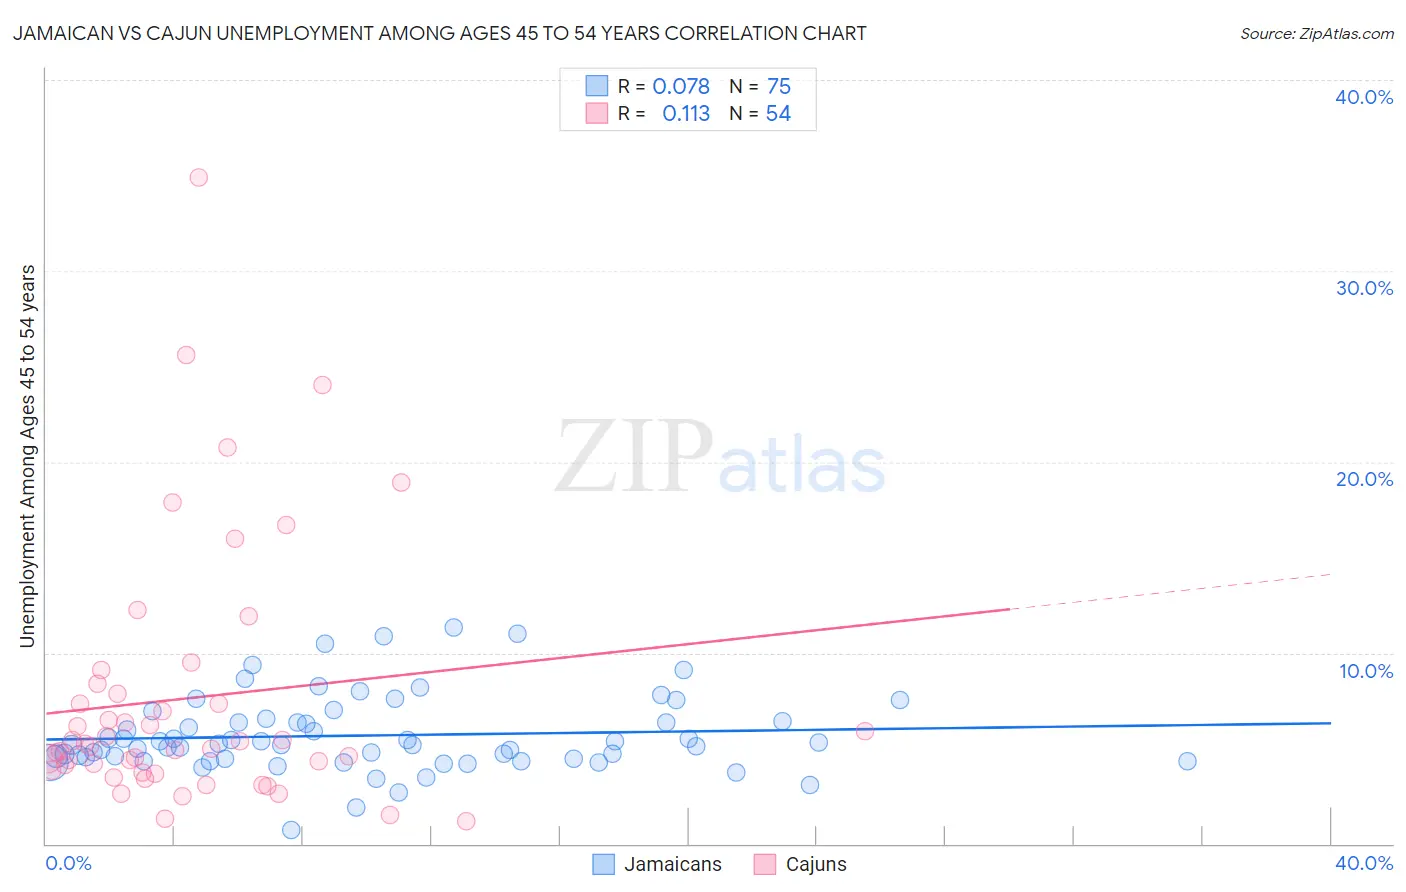
Jamaican vs Cajun Unemployment Among Ages 45 to 54 years Correlation Chart
The statistical analysis conducted on geographies consisting of 359,919,421 people shows a slight positive correlation between the proportion of Jamaicans and unemployment rate among population between the ages 45 and 54 in the United States with a correlation coefficient (R) of 0.078 and weighted average of 5.3%. Similarly, the statistical analysis conducted on geographies consisting of 146,835,956 people shows a poor positive correlation between the proportion of Cajuns and unemployment rate among population between the ages 45 and 54 in the United States with a correlation coefficient (R) of 0.113 and weighted average of 5.0%, a difference of 5.8%.
Unemployment Among Ages 45 to 54 years Correlation Summary
| Measurement | Jamaican | Cajun |
| Minimum | 0.70% | 1.2% |
| Maximum | 11.3% | 34.9% |
| Range | 10.6% | 33.7% |
| Mean | 5.7% | 7.6% |
| Median | 5.2% | 5.2% |
| Interquartile 25% (IQ1) | 4.5% | 3.9% |
| Interquartile 75% (IQ3) | 6.4% | 7.8% |
| Interquartile Range (IQR) | 2.0% | 4.0% |
| Standard Deviation (Sample) | 2.0% | 6.8% |
| Standard Deviation (Population) | 2.0% | 6.7% |
Similar Demographics by Unemployment Among Ages 45 to 54 years
Demographics Similar to Jamaicans by Unemployment Among Ages 45 to 54 years
In terms of unemployment among ages 45 to 54 years, the demographic groups most similar to Jamaicans are Belizean (5.2%, a difference of 0.15%), Aleut (5.3%, a difference of 0.18%), West Indian (5.3%, a difference of 0.19%), Immigrants from Trinidad and Tobago (5.3%, a difference of 0.31%), and Ecuadorian (5.3%, a difference of 0.33%).
| Demographics | Rating | Rank | Unemployment Among Ages 45 to 54 years |
| Immigrants | Caribbean | 0.0 /100 | #288 | Tragic 5.2% |
| Immigrants | Haiti | 0.0 /100 | #289 | Tragic 5.2% |
| Immigrants | Portugal | 0.0 /100 | #290 | Tragic 5.2% |
| Armenians | 0.0 /100 | #291 | Tragic 5.2% |
| Trinidadians and Tobagonians | 0.0 /100 | #292 | Tragic 5.2% |
| Immigrants | Senegal | 0.0 /100 | #293 | Tragic 5.2% |
| Belizeans | 0.0 /100 | #294 | Tragic 5.2% |
| Jamaicans | 0.0 /100 | #295 | Tragic 5.3% |
| Aleuts | 0.0 /100 | #296 | Tragic 5.3% |
| West Indians | 0.0 /100 | #297 | Tragic 5.3% |
| Immigrants | Trinidad and Tobago | 0.0 /100 | #298 | Tragic 5.3% |
| Ecuadorians | 0.0 /100 | #299 | Tragic 5.3% |
| Central American Indians | 0.0 /100 | #300 | Tragic 5.3% |
| Menominee | 0.0 /100 | #301 | Tragic 5.3% |
| Immigrants | Ecuador | 0.0 /100 | #302 | Tragic 5.3% |
Demographics Similar to Cajuns by Unemployment Among Ages 45 to 54 years
In terms of unemployment among ages 45 to 54 years, the demographic groups most similar to Cajuns are Immigrants from Ghana (5.0%, a difference of 0.070%), Immigrants from Central America (5.0%, a difference of 0.17%), Somali (5.0%, a difference of 0.22%), Immigrants from Latin America (5.0%, a difference of 0.33%), and U.S. Virgin Islander (5.0%, a difference of 0.39%).
| Demographics | Rating | Rank | Unemployment Among Ages 45 to 54 years |
| Immigrants | Guatemala | 0.1 /100 | #264 | Tragic 4.9% |
| Immigrants | Somalia | 0.1 /100 | #265 | Tragic 4.9% |
| Ghanaians | 0.0 /100 | #266 | Tragic 4.9% |
| Bahamians | 0.0 /100 | #267 | Tragic 4.9% |
| Immigrants | Uzbekistan | 0.0 /100 | #268 | Tragic 4.9% |
| Somalis | 0.0 /100 | #269 | Tragic 5.0% |
| Immigrants | Ghana | 0.0 /100 | #270 | Tragic 5.0% |
| Cajuns | 0.0 /100 | #271 | Tragic 5.0% |
| Immigrants | Central America | 0.0 /100 | #272 | Tragic 5.0% |
| Immigrants | Latin America | 0.0 /100 | #273 | Tragic 5.0% |
| U.S. Virgin Islanders | 0.0 /100 | #274 | Tragic 5.0% |
| Bermudans | 0.0 /100 | #275 | Tragic 5.0% |
| French American Indians | 0.0 /100 | #276 | Tragic 5.0% |
| Immigrants | Mexico | 0.0 /100 | #277 | Tragic 5.0% |
| Dutch West Indians | 0.0 /100 | #278 | Tragic 5.0% |